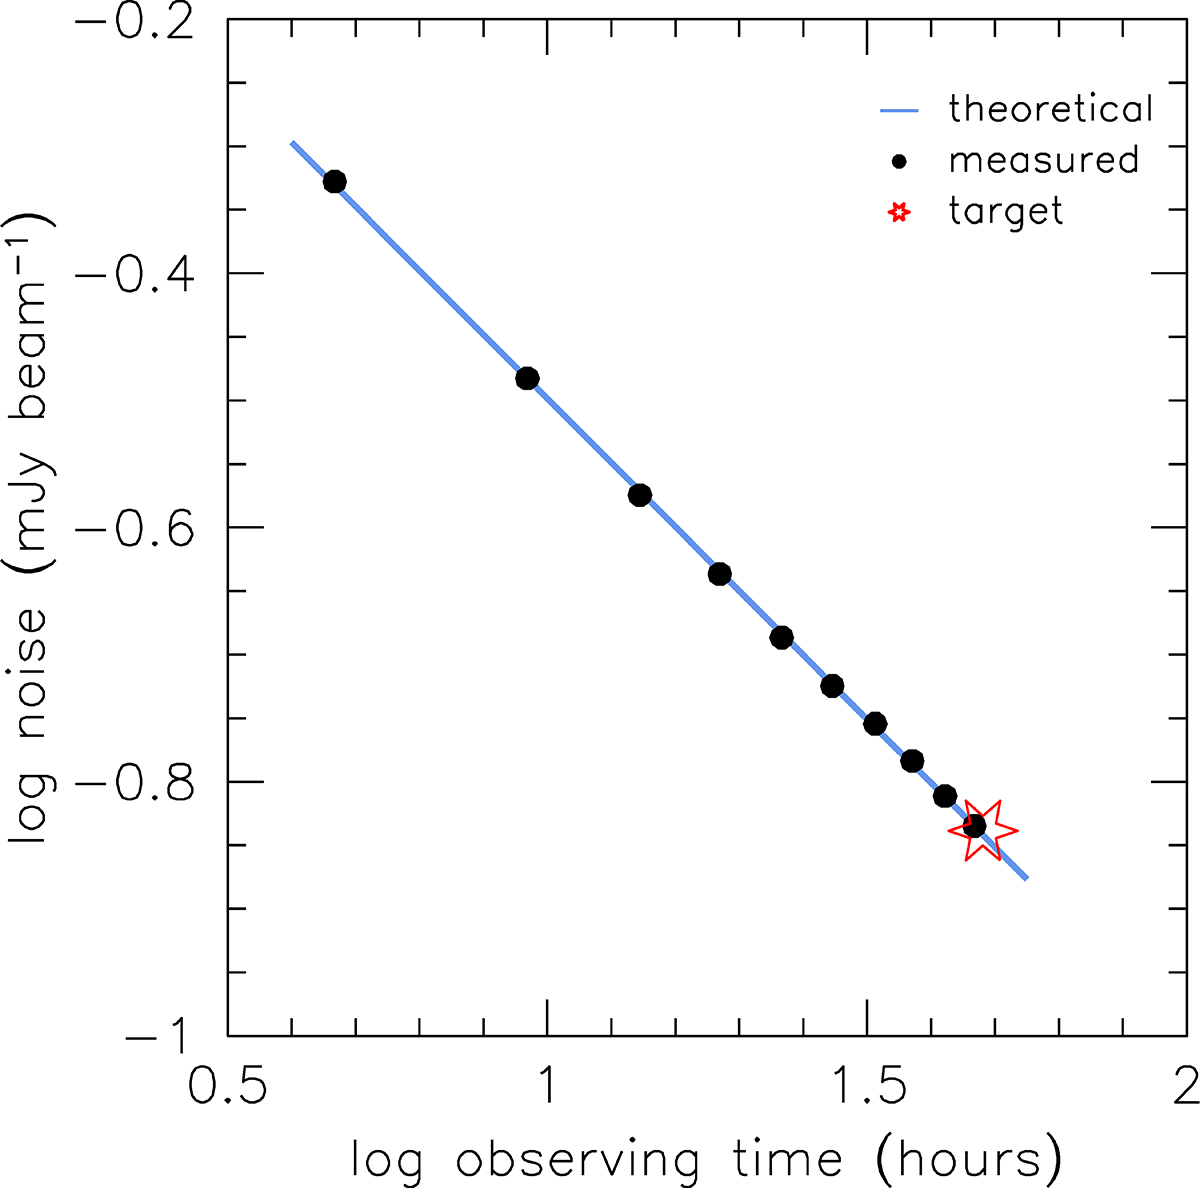
Fig. 6.
Download original image
Natural-weighted noise values measured over a 1.4 km s−1 channel as a function of integration time for the observations of ESO 300-G014 (J0309–41). The black filled points indicate the measured noise level. The blue line shows the expected theoretical noise levels with a slope of −0.5. A linear fit to the observed noise levels gives a slope of −0.504. The red star indicates the target sensitivity from de Blok et al. (2016).
Current usage metrics show cumulative count of Article Views (full-text article views including HTML views, PDF and ePub downloads, according to the available data) and Abstracts Views on Vision4Press platform.
Data correspond to usage on the plateform after 2015. The current usage metrics is available 48-96 hours after online publication and is updated daily on week days.
Initial download of the metrics may take a while.