Fig. 5.
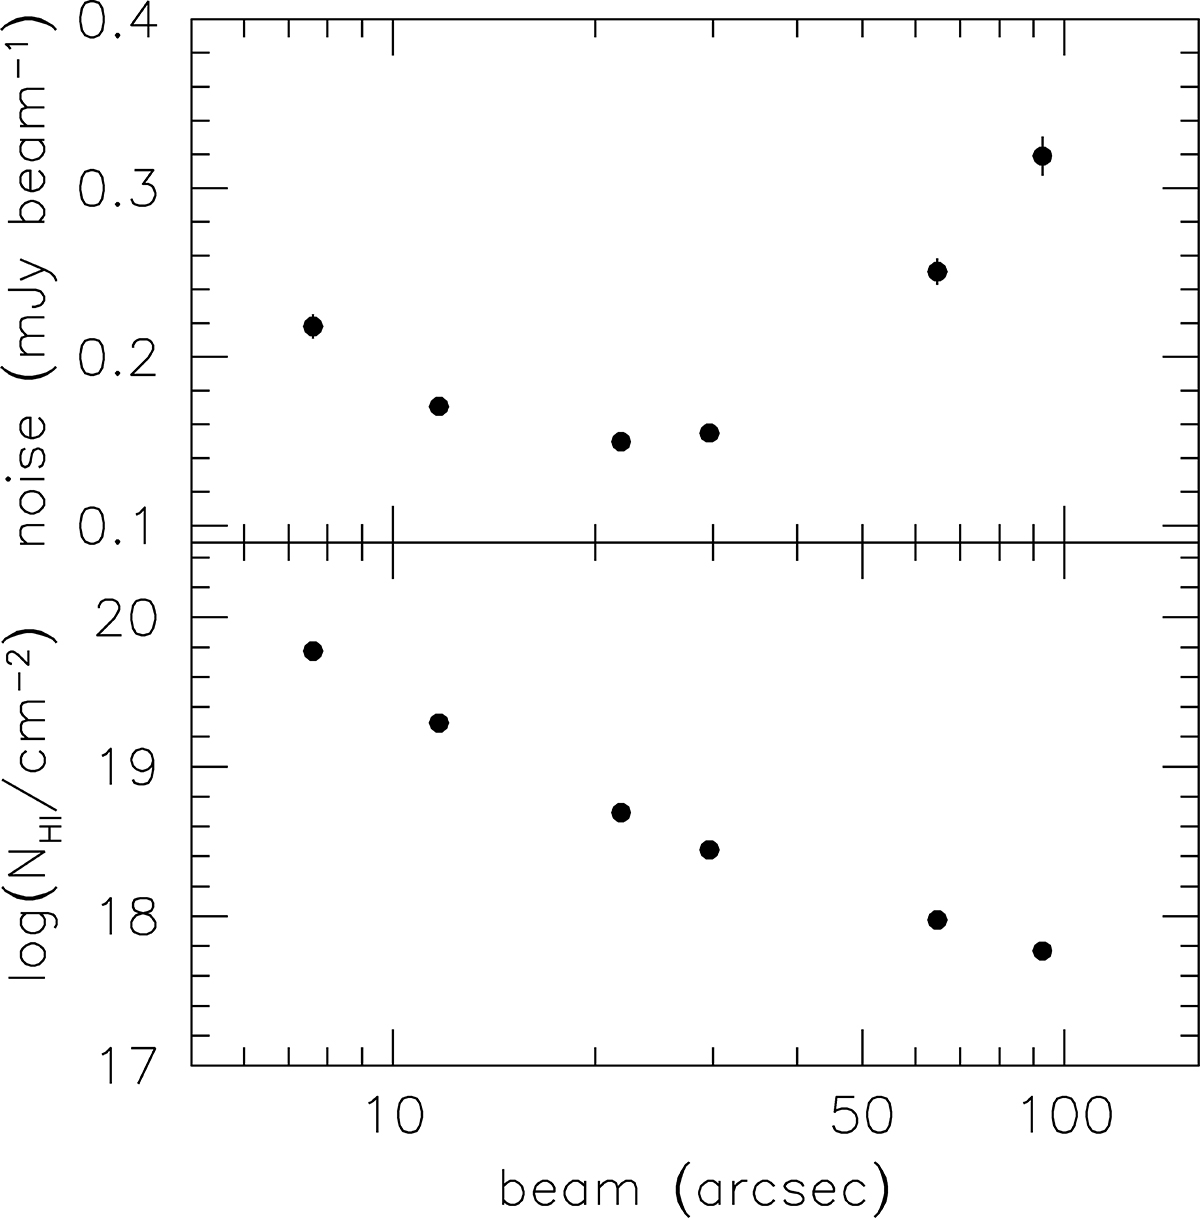
Download original image
Sensitivities of the full-depth data cubes. The top panel shows the average noise per 1.4 km s−1 channel for the six standard resolutions, as averaged over full-depth observations of ten galaxies (cf. Fig. 1). Error bars show the rms difference in noise levels between the ten galaxies, but are generally comparable to or smaller than the symbol size. The bottom panel shows the 3σ, 16 km s−1 column density sensitivities. These are the same points as shown in Fig. 2.
Current usage metrics show cumulative count of Article Views (full-text article views including HTML views, PDF and ePub downloads, according to the available data) and Abstracts Views on Vision4Press platform.
Data correspond to usage on the plateform after 2015. The current usage metrics is available 48-96 hours after online publication and is updated daily on week days.
Initial download of the metrics may take a while.