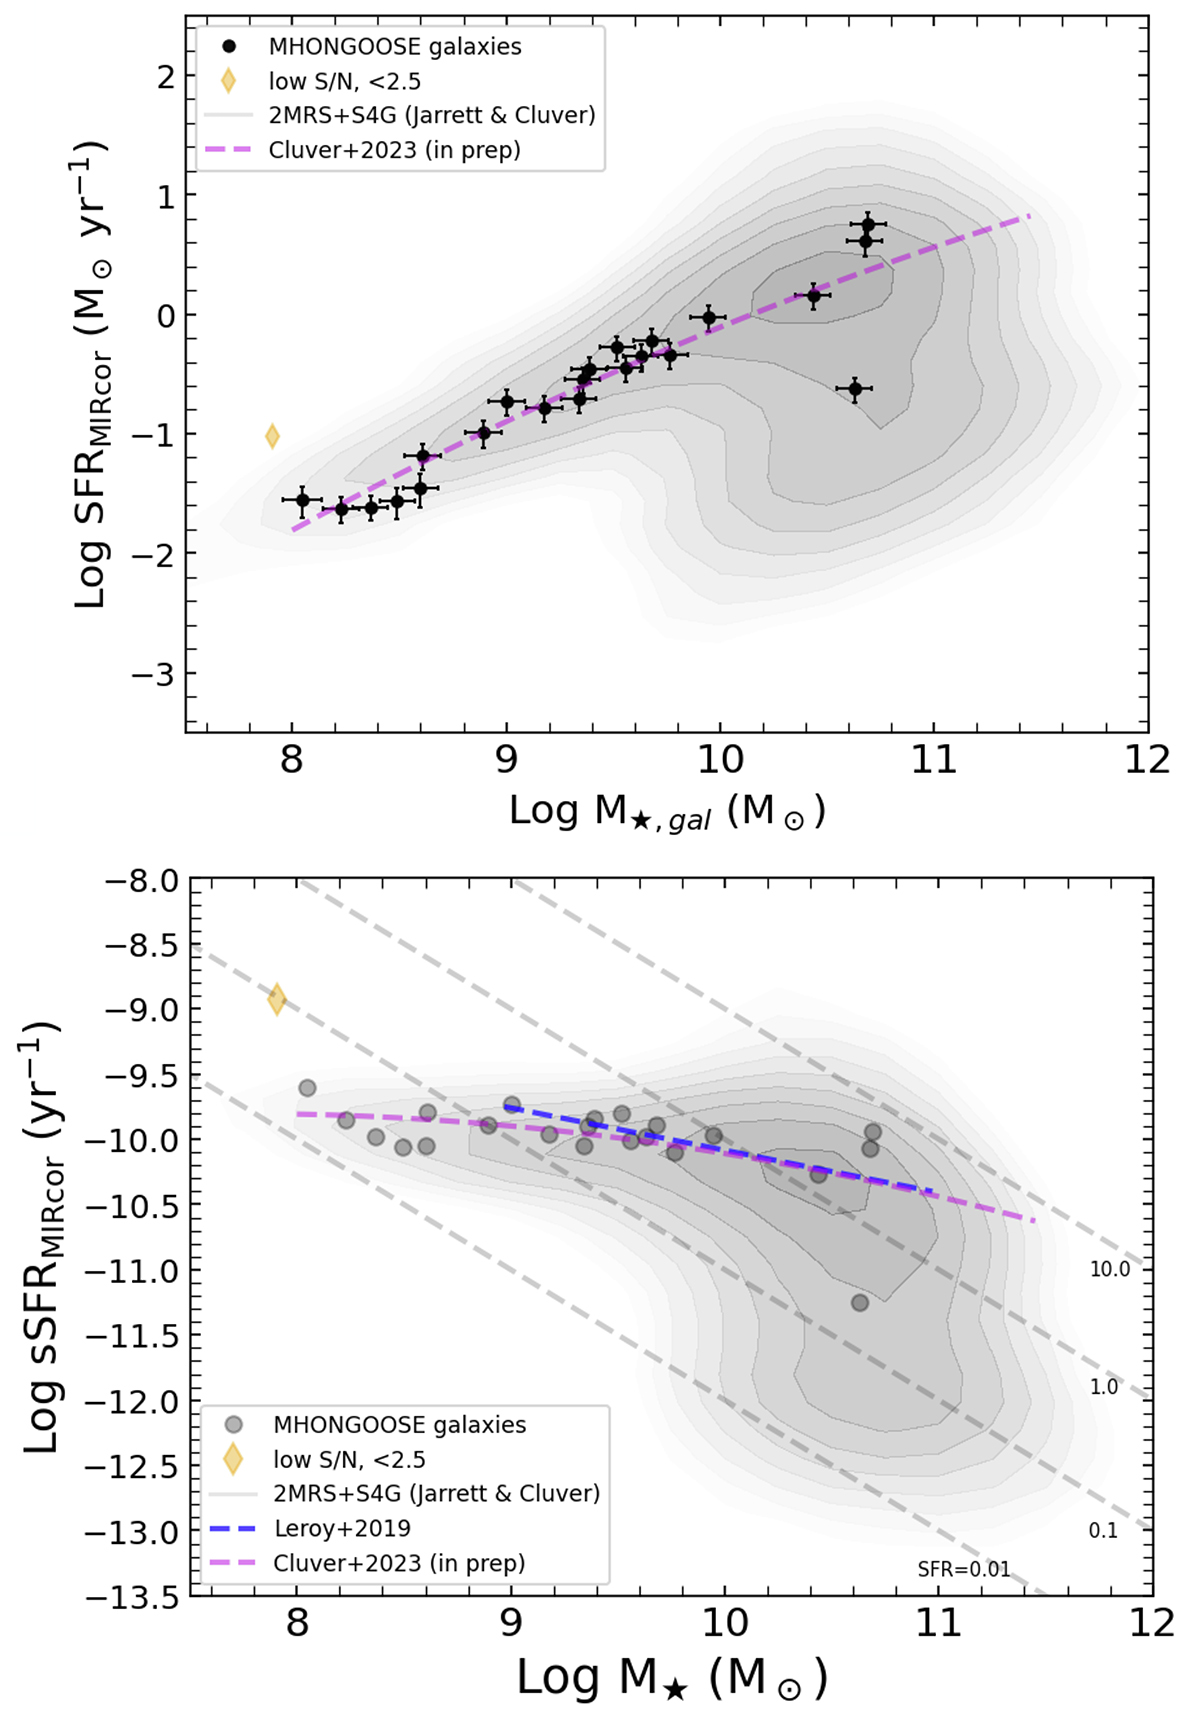
Fig. 3.
Download original image
Star formation rates of the MHONGOOSE galaxies plotted against their stellar masses. Top panel: the SFR as derived using the method described in Cluver et al. (in prep.) based on mid-IR and UV SFRs. The stellar masses are derived from WISE W3 and W4 luminosities as described in Jarrett et al. (2023). Background grayscale and gray contours show the distribution of galaxies in the local Universe based on mid-IR and UV data (Jarrett & Cluver, in prep.). The MHONGOOSE sample was selected to be representative of the SFR–M⋆ main sequence (the upper ridge of the distributions) and almost all galaxies are indeed on this sequence. Only NGC 1371 (J0335–24) has a low SFR for its mass. Galaxies with uncertain SFR values are not plotted (see Table 1). UGCA320 (J1303–17b) has a low S/N in the WISE observations as indicated by the diamond symbol. The purple dashed curve shows the average trend derived in Cluver et al. (in prep.). Bottom panel: this shows the specific SFR of the MHONGOOSE galaxies plotted against stellar mass. Symbols and curves as in top panel. In addition, the blue curve shows a fit to the data presented in Leroy et al. (2019). The diagonal gray dashed lines indicate corresponding SFR values in M⊙ yr−1.
Current usage metrics show cumulative count of Article Views (full-text article views including HTML views, PDF and ePub downloads, according to the available data) and Abstracts Views on Vision4Press platform.
Data correspond to usage on the plateform after 2015. The current usage metrics is available 48-96 hours after online publication and is updated daily on week days.
Initial download of the metrics may take a while.