Fig. 16.
Download original image
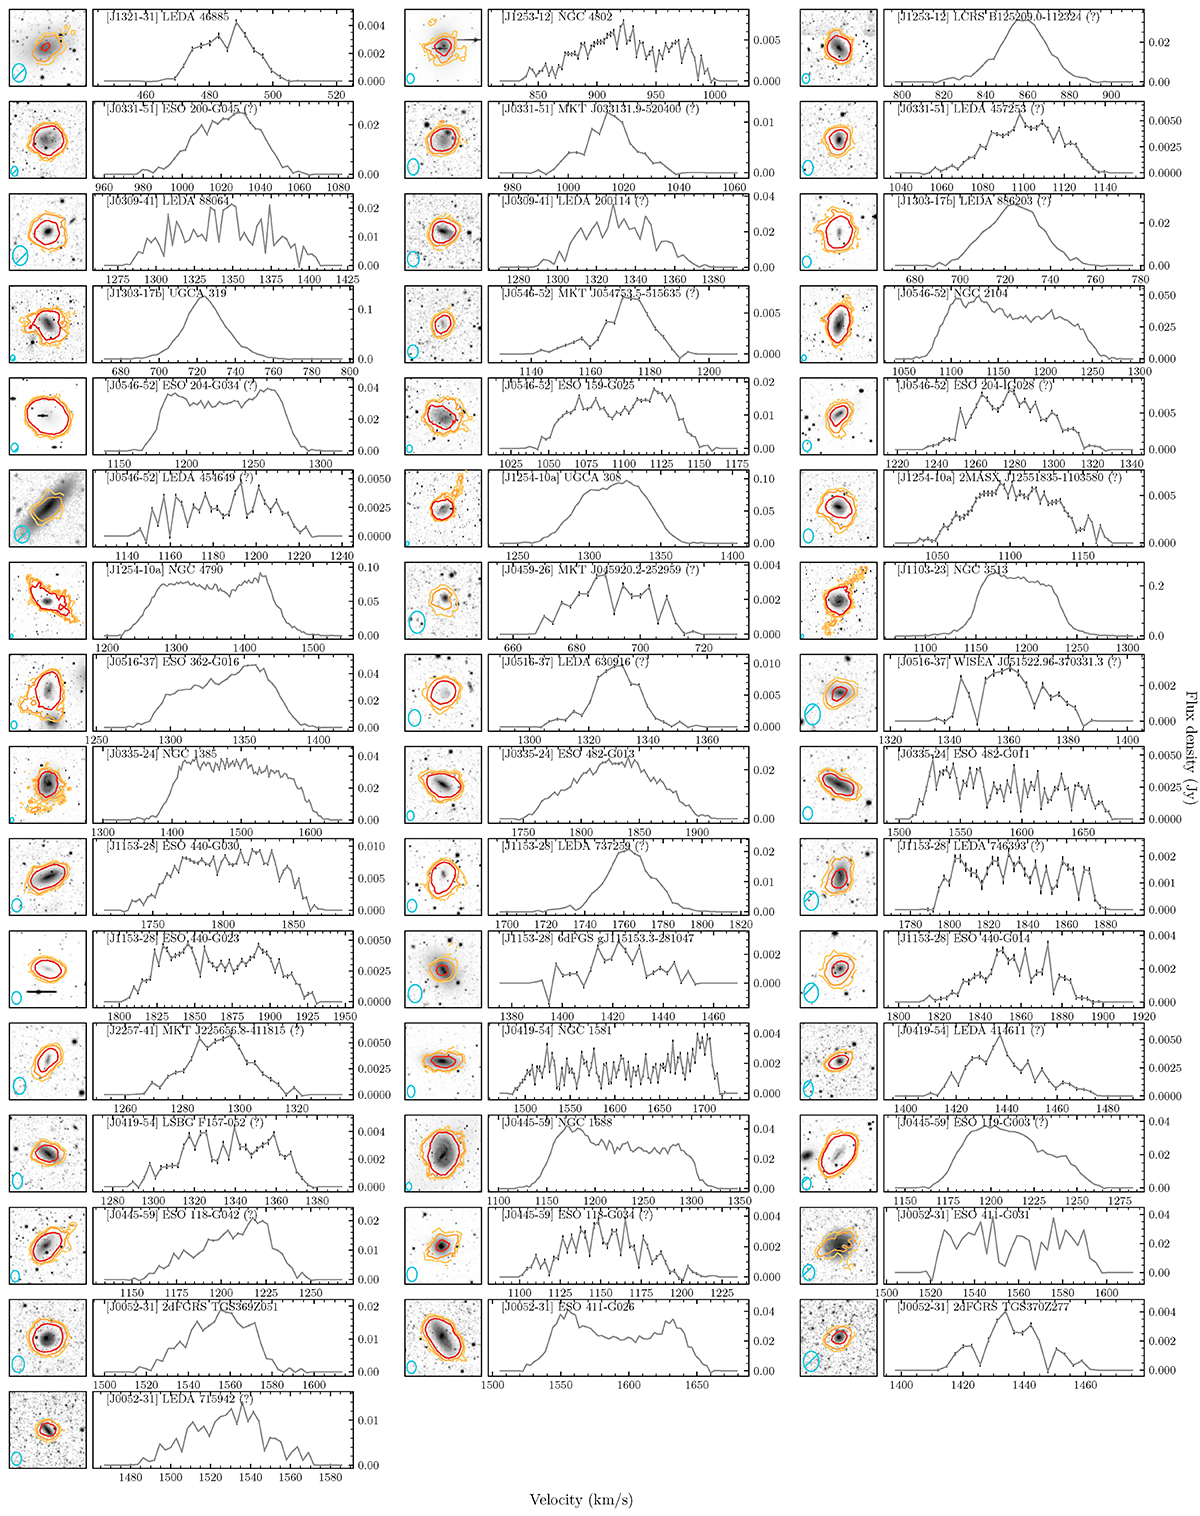
Grayscale cutouts from DECaLS DR10 g-band centred on the additional H I detections. Contours indicate H I column densities at S/N = 3, 5, 10 (from orange to red). Spectra have been binned by a factor two with a resulting channel width of 2.8 km s−1. These spectra were used to derive the parameters listed in Table 7. All spectra are based on r15_t00 data, except for J0546-52 LEDA 454649 which is based on r05_t00 data.
Current usage metrics show cumulative count of Article Views (full-text article views including HTML views, PDF and ePub downloads, according to the available data) and Abstracts Views on Vision4Press platform.
Data correspond to usage on the plateform after 2015. The current usage metrics is available 48-96 hours after online publication and is updated daily on week days.
Initial download of the metrics may take a while.