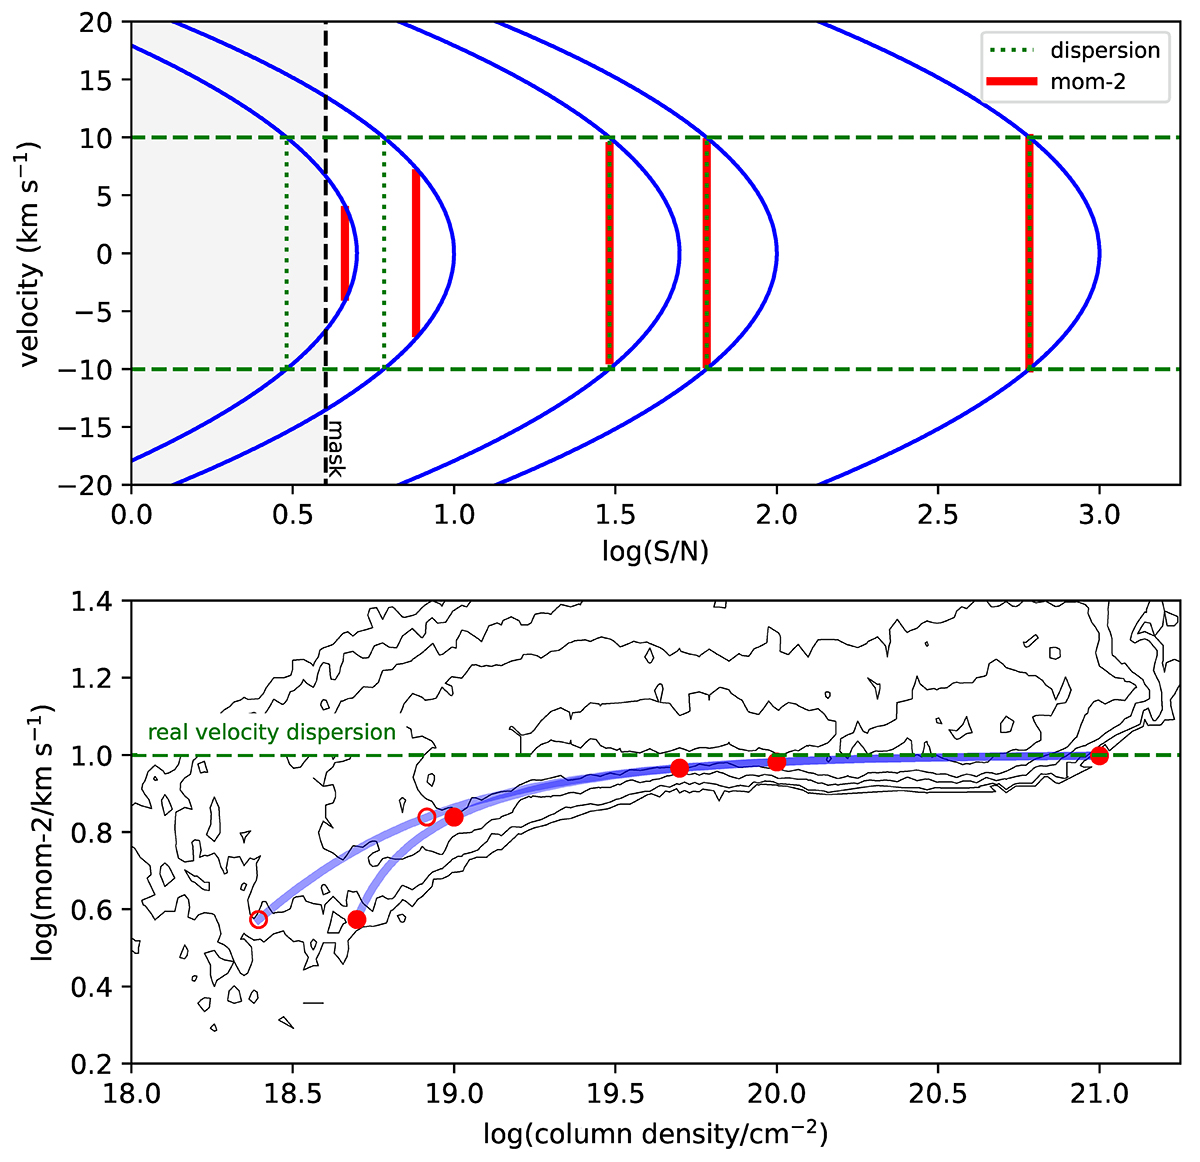
Fig. 14.
Download original image
Illustration of the change in zeroth- and second-moment values due to masking. The top panel shows a number of Gaussians, here plotted as a function of velocity as given by the vertical axis, while the horizontal axis indicates the peak value of the Gaussian in terms of S/N. From right to left the peak values are 1000, 100, 50, 10 and 5 times the S/N. The dashed vertical black line indicates the 4 times S/N level where masking occurs. Each profile has a velocity dispersion of 10 km s−1 as indicated by the horizontal dashed green lines, and, for each Gaussian separately, the dotted vertical green lines. The thick red lines indicate the measured second-moment values for each Gaussian, assuming they are masked at 4 times the S/N. The bottom panel shows the change in zeroth and second moment values. Here we have lined up the positions of the peaks in the top panel with those of the points in the bottom panel by assuming that a column density of 1021 cm−2 corresponds to a S/N of 1000. This is consistent with the data presented in Fig. 13 that are shown here as contours. The curve extending to the left (open circles) takes into account that the total flux of the Gaussian decreases due to masking, the right-hand curve (closed circles) ignores this. For other assumed velocity dispersions, the shape of the curve does not change but will shift up (larger dispersions) or down (lower dispersions).
Current usage metrics show cumulative count of Article Views (full-text article views including HTML views, PDF and ePub downloads, according to the available data) and Abstracts Views on Vision4Press platform.
Data correspond to usage on the plateform after 2015. The current usage metrics is available 48-96 hours after online publication and is updated daily on week days.
Initial download of the metrics may take a while.