Fig. 11.
Download original image
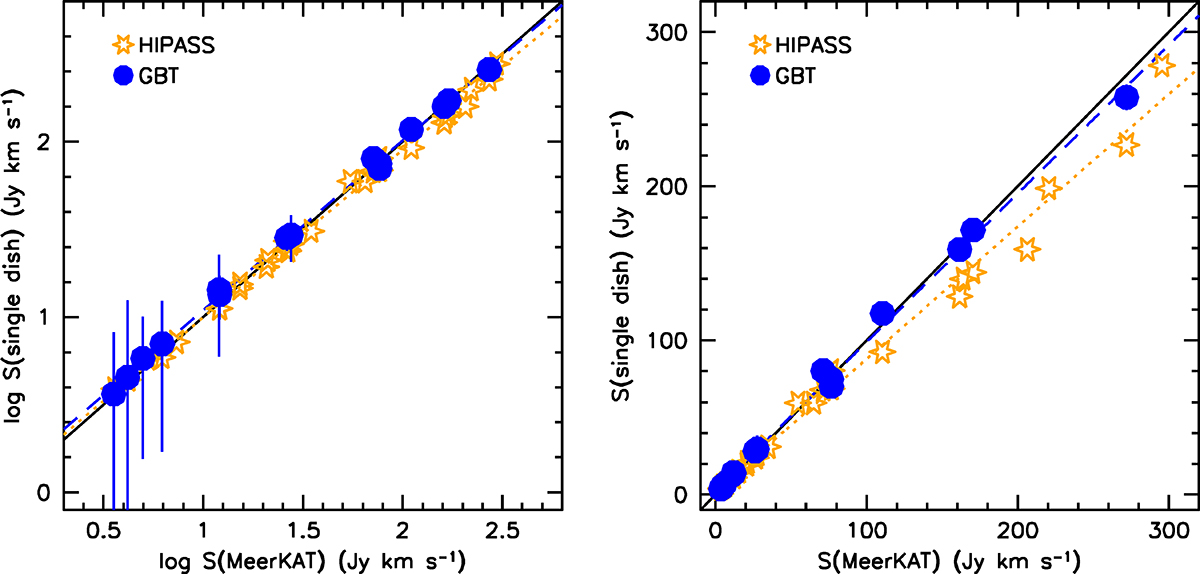
Comparison of the single-track MeerKAT flux densities with single-dish flux densities. Stars (orange) indicate HIPASS values, filled circles (blue) GBT values. The full black line indicates a unity slope. The left panel compares the flux densities on a logarithmic scale, the right panel shows the same data points on a linear scale. The dashed blue line is a fit to the GBT points. The fit to the logarithmic GBT values has a slope of 0.968, the linear values give a fit with a slope of 0.954. The dotted orange line is a fit to the HIPASS data. Here the logarithmic slope is 0.964, the linear fit gives a slope of 0.860.
Current usage metrics show cumulative count of Article Views (full-text article views including HTML views, PDF and ePub downloads, according to the available data) and Abstracts Views on Vision4Press platform.
Data correspond to usage on the plateform after 2015. The current usage metrics is available 48-96 hours after online publication and is updated daily on week days.
Initial download of the metrics may take a while.