Fig. 1.
Download original image
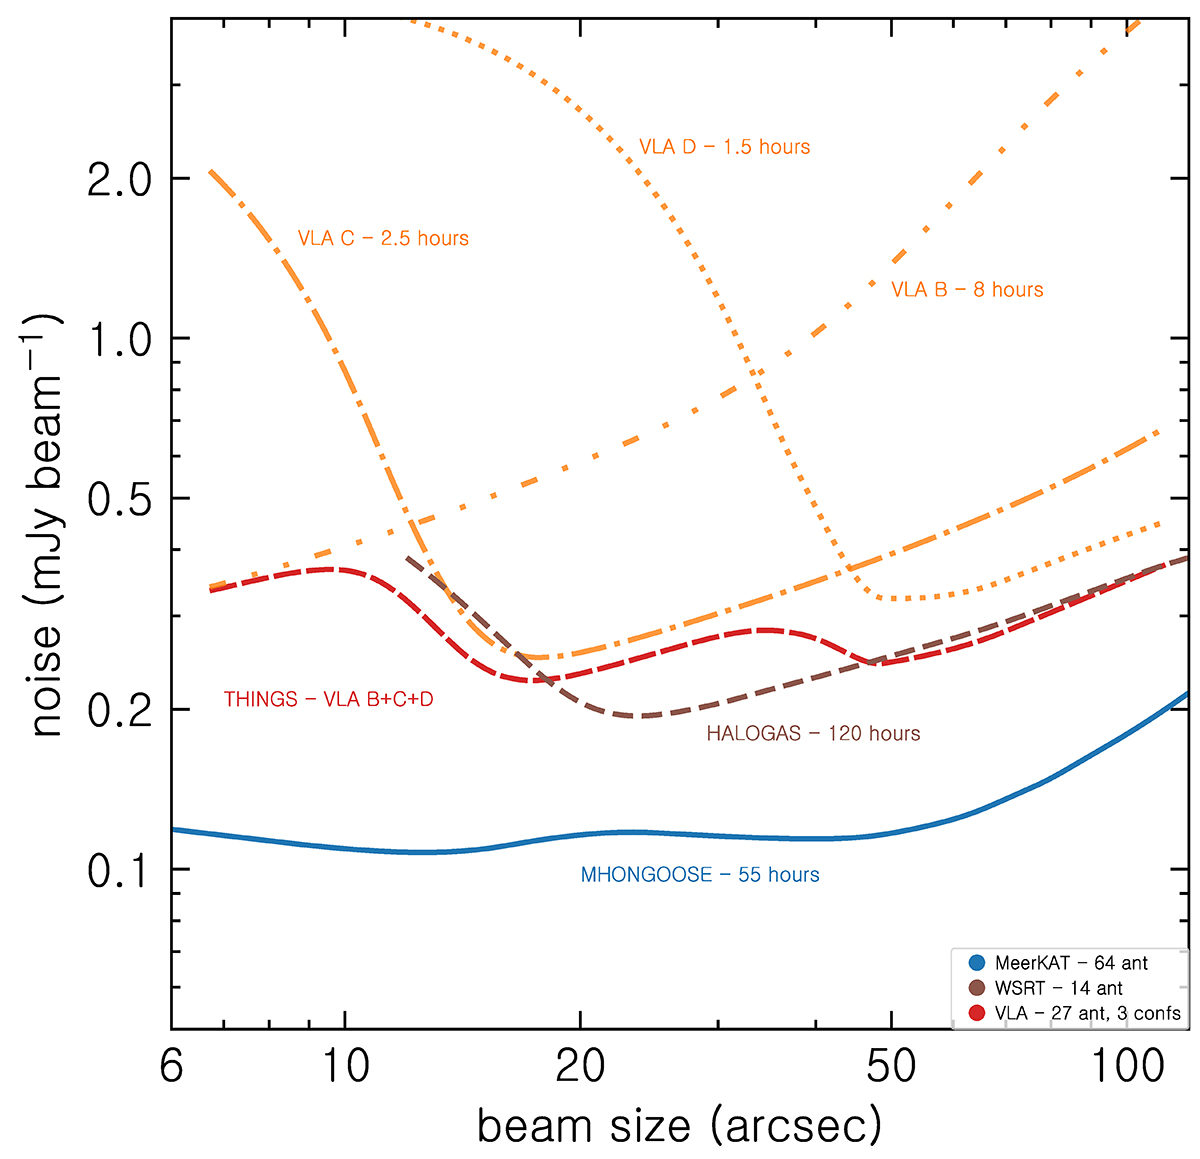
Noise level as a function of resolution for the HALOGAS, THINGS, and MHONGOOSE surveys. The blue curve shows that the MHONGOOSE survey has a flat noise distribution, meaning equally sensitive imaging can be obtained over a large range of resolutions between ∼6″ and ∼90″. The dashed brown curve shows the HALOGAS survey, with an optimal sensitivity at around ∼20″. The dashed red curve represents the THINGS survey. This is a combination of three separate VLA array configurations (also shown at the top of the plot calculated using the correct relative observing times). THINGS has optimal sensitivity at around ∼15″ and ∼50″. All noise values are calculated over a 5 km s−1 channel.
Current usage metrics show cumulative count of Article Views (full-text article views including HTML views, PDF and ePub downloads, according to the available data) and Abstracts Views on Vision4Press platform.
Data correspond to usage on the plateform after 2015. The current usage metrics is available 48-96 hours after online publication and is updated daily on week days.
Initial download of the metrics may take a while.