Fig. 8.
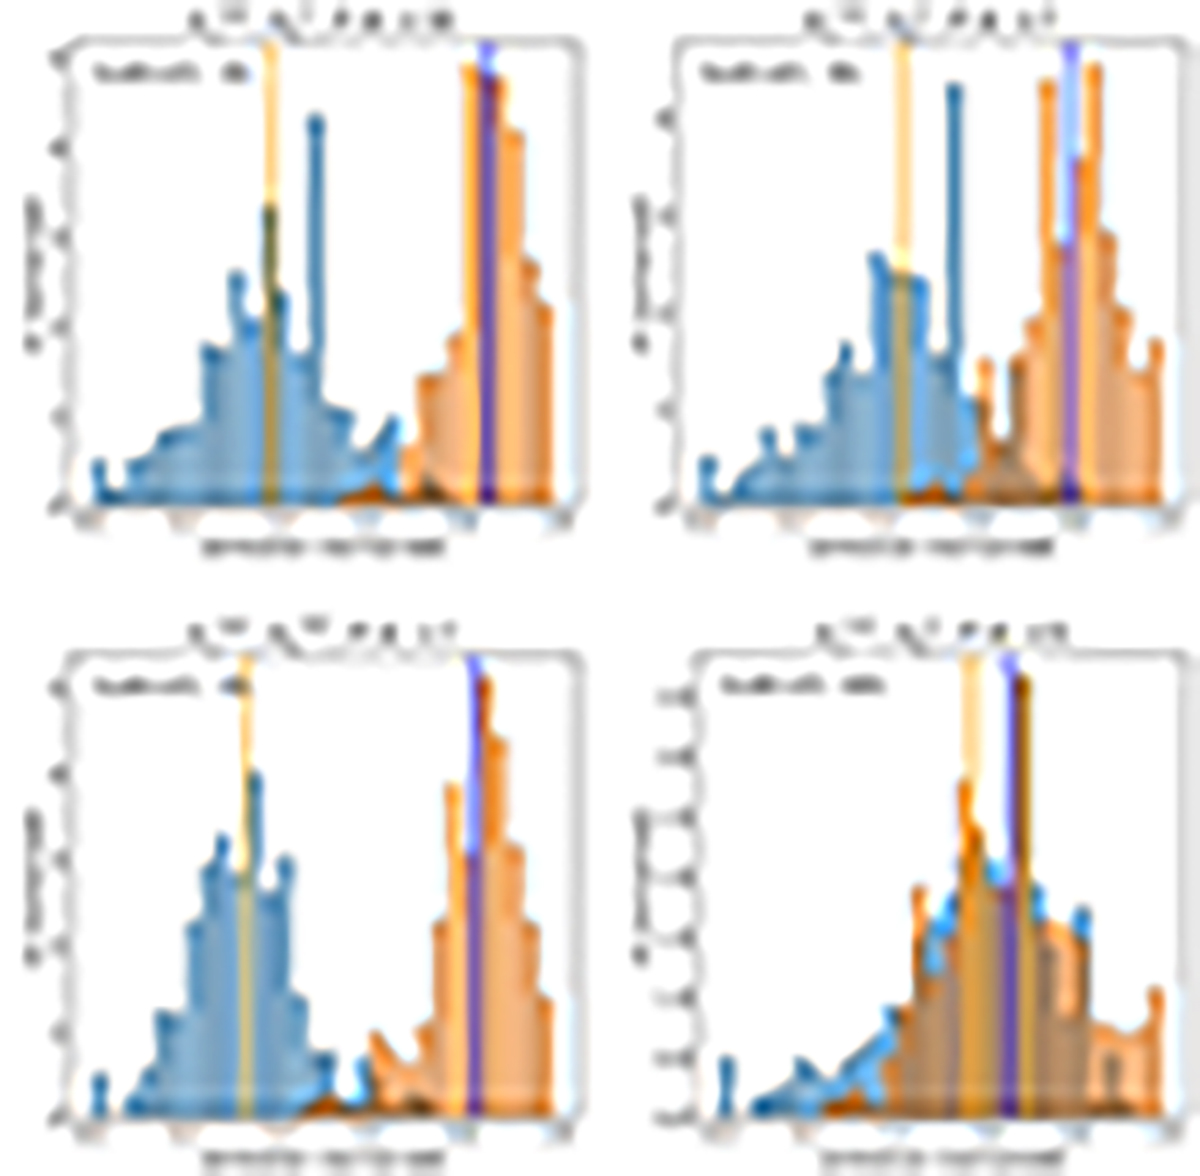
Download original image
Histograms with the distribution of correlation coefficients obtained by scanning through the correlation maps with the angles of attack obtained from PSP measurements using a mean field with a moving average of 30 min. The specific spectral and power anisotropies are shown at the top of each histogram plot. The orange (blue) bars represent the perpendicular (parallel) correlations, and the vertical lines represent the mean value of the correlation for the entire encounter period analyzed. Also shown is the percentage of points for which the parallel correlation value is higher than the perpendicular one.
Current usage metrics show cumulative count of Article Views (full-text article views including HTML views, PDF and ePub downloads, according to the available data) and Abstracts Views on Vision4Press platform.
Data correspond to usage on the plateform after 2015. The current usage metrics is available 48-96 hours after online publication and is updated daily on week days.
Initial download of the metrics may take a while.