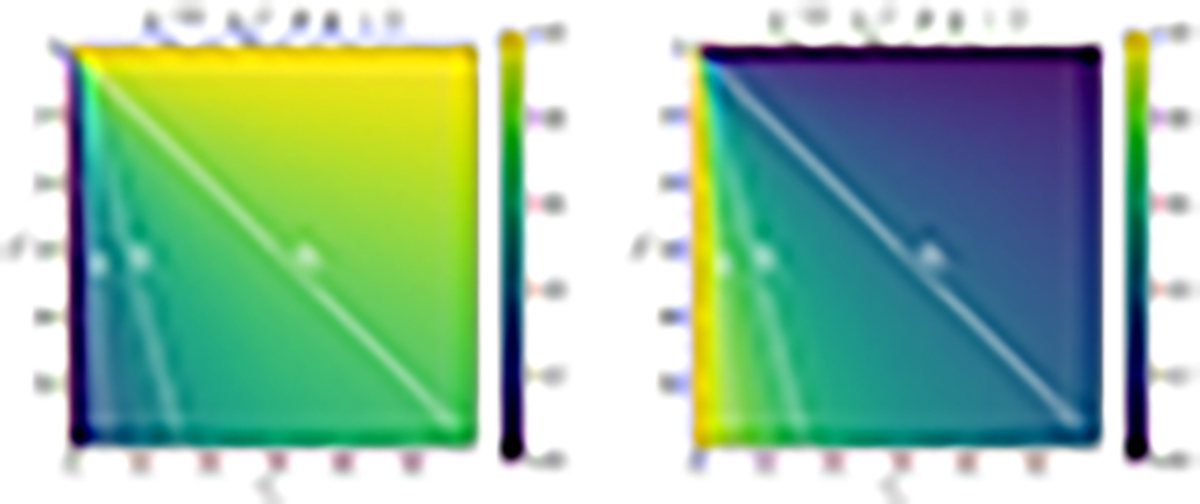
Fig. 5.
Download original image
Cross-correlation map of the total (dt) and perpendicular (left, ∂T) and total and parallel (right, ∂R) gradients for different r, ranging from zero to 60 in both perpendicular (r⊥) and parallel (r∥) directions. The unit distance corresponds to 500 km in the solar wind plasma frame. The title indicates the noise map used. The overplotted straight white lines of different slopes indicate different angles of attack.
Current usage metrics show cumulative count of Article Views (full-text article views including HTML views, PDF and ePub downloads, according to the available data) and Abstracts Views on Vision4Press platform.
Data correspond to usage on the plateform after 2015. The current usage metrics is available 48-96 hours after online publication and is updated daily on week days.
Initial download of the metrics may take a while.