Open Access
Fig. 4.
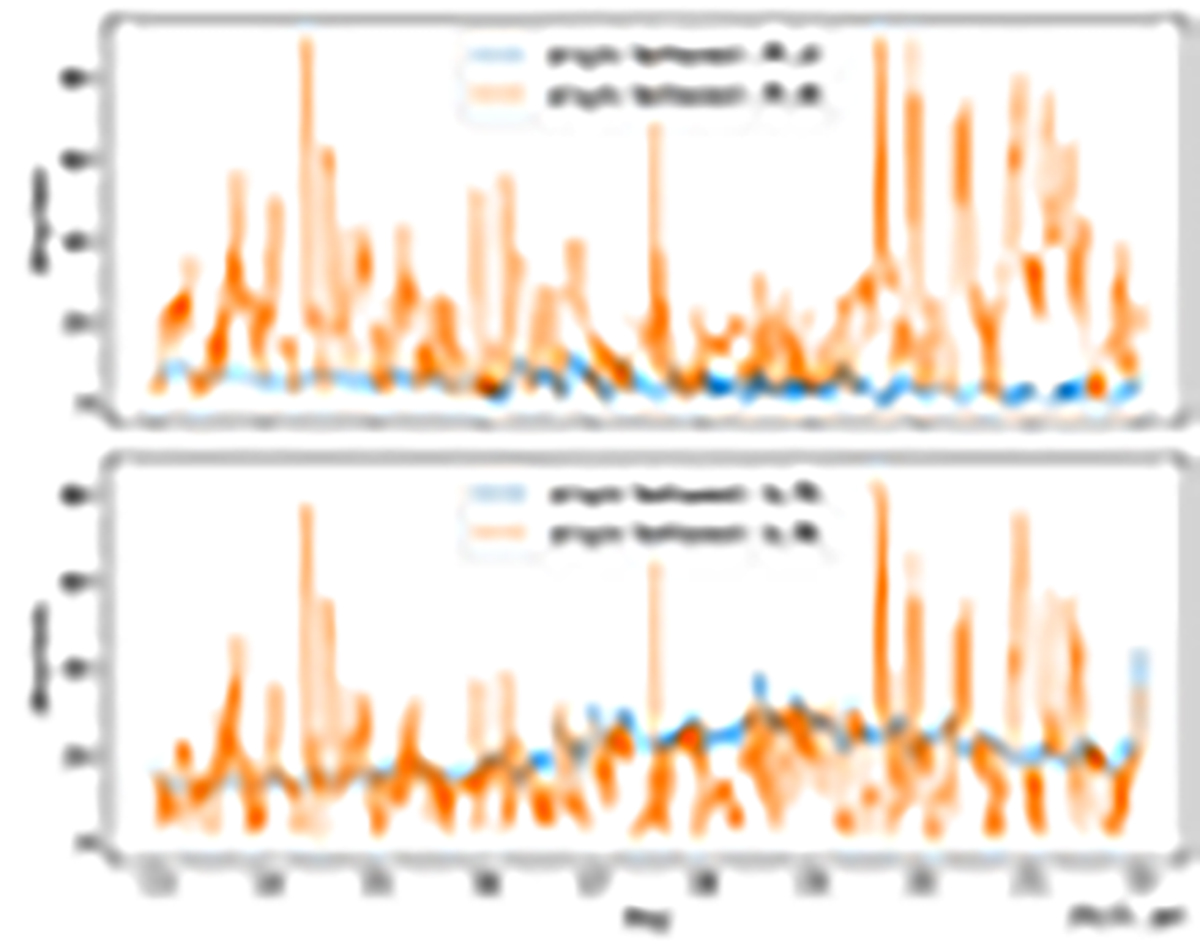
Download original image
Plots of the angle between the radial direction and 30-min moving average velocity and magnetic field direction (top graph) and the angle between the PSP velocity vector relative to the background flow(s) and the radial direction and average magnetic field direction (bottom graph) for the in situ PSP data shown in Fig. 3.
Current usage metrics show cumulative count of Article Views (full-text article views including HTML views, PDF and ePub downloads, according to the available data) and Abstracts Views on Vision4Press platform.
Data correspond to usage on the plateform after 2015. The current usage metrics is available 48-96 hours after online publication and is updated daily on week days.
Initial download of the metrics may take a while.