Fig. 5
Download original image
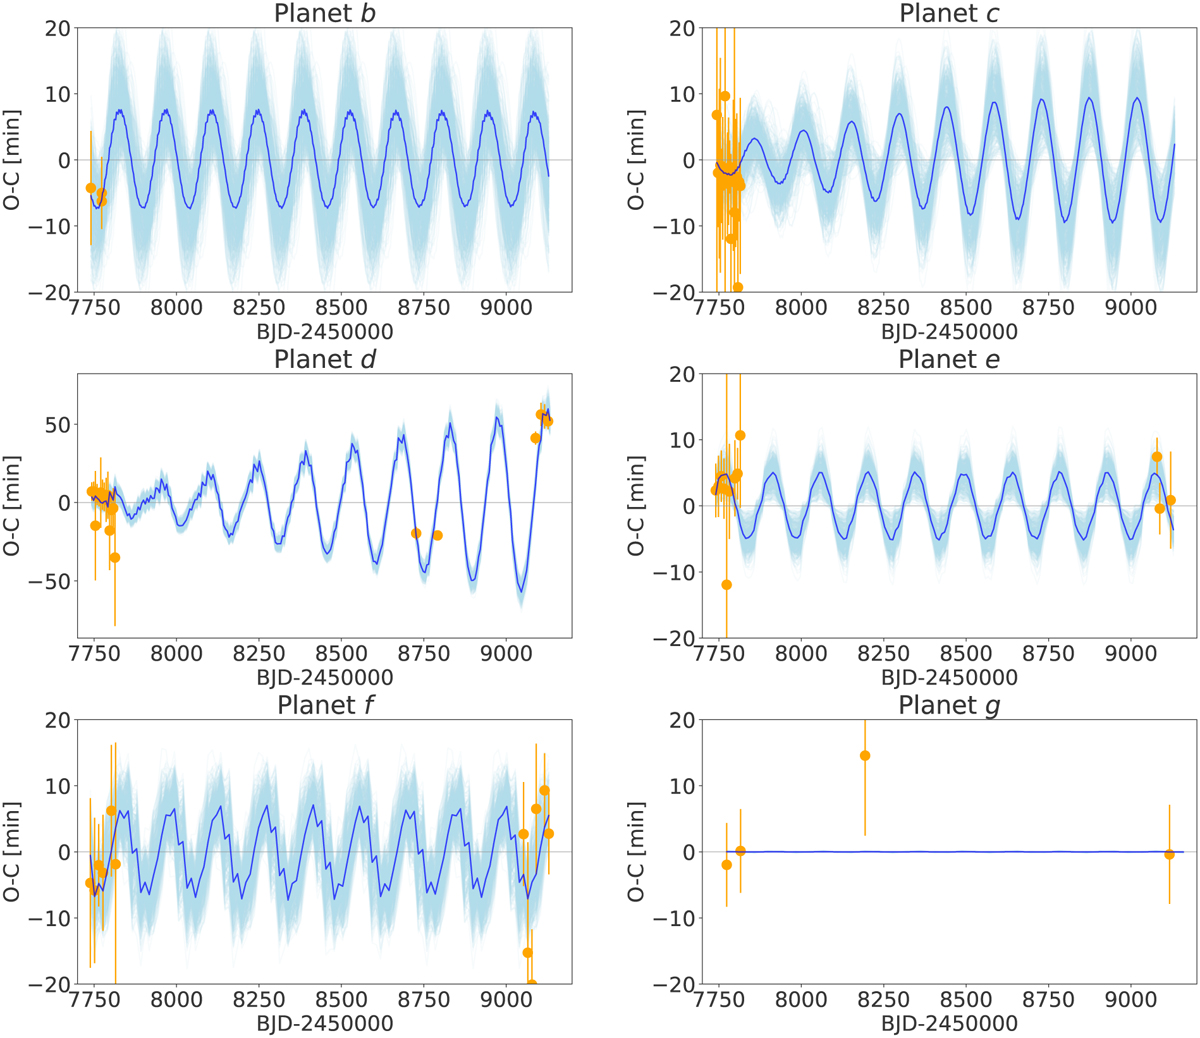
Results of TTV simulations of the K2-138 planetary system. The orange points represent the observed transit time residuals for each planet, reported in Tables C.1 and C.2. The best-fit TTV models obtained with TTVfaster and its ±1σ errors are represented respectively by the blue curve and region, and are detailed in Table 6.
Current usage metrics show cumulative count of Article Views (full-text article views including HTML views, PDF and ePub downloads, according to the available data) and Abstracts Views on Vision4Press platform.
Data correspond to usage on the plateform after 2015. The current usage metrics is available 48-96 hours after online publication and is updated daily on week days.
Initial download of the metrics may take a while.