Fig. 4
Download original image
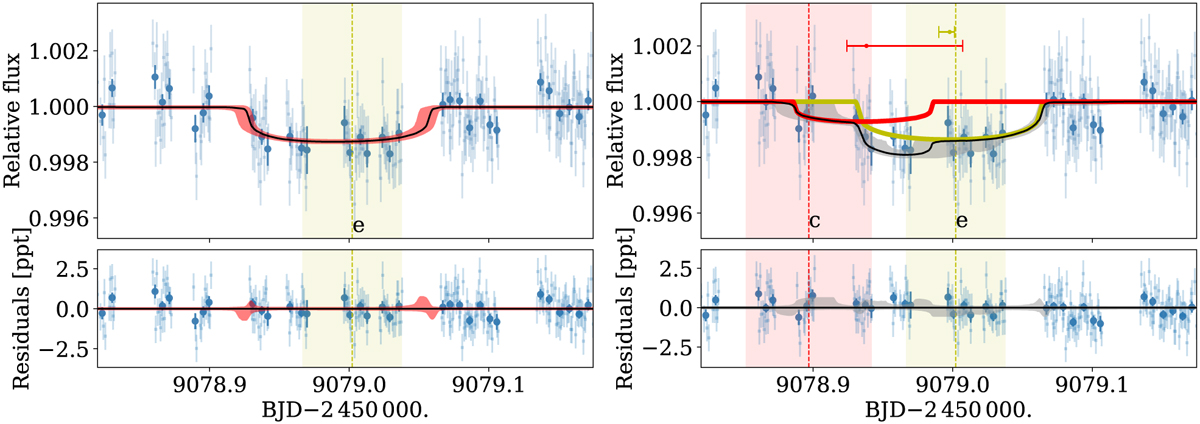
Modeling of CHEOPS visit 201. The detrended photometric points and its 10-min bins are represented by the light and dark blue symbols. The predicted transit times from A22 (±lσ) of each planet are represented by the vertical regions. The left panel shows the fit of planet e transit only. The model and its ±lσ uncertainties shown with the black curve and red region, respectively. The right panel shows the fit including transit of both planets c and e. The fitted transit of planet c and e are represented by the red and yellow curves, respectively, while the full model (±lσ) is represented by the black curve (and gray area). The two horizontal lines at the top of the panel represents the fitted transit mid-time for each planet and its ±lσ errors.
Current usage metrics show cumulative count of Article Views (full-text article views including HTML views, PDF and ePub downloads, according to the available data) and Abstracts Views on Vision4Press platform.
Data correspond to usage on the plateform after 2015. The current usage metrics is available 48-96 hours after online publication and is updated daily on week days.
Initial download of the metrics may take a while.