Fig. 1
Download original image
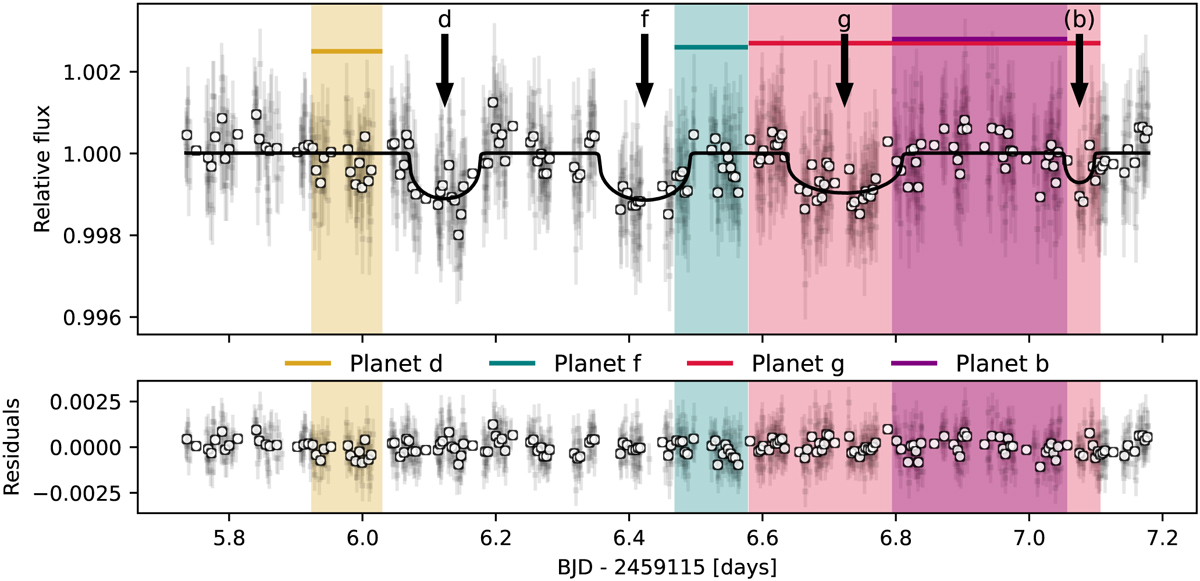
Detгended light curve of CHEOPS visit 501. The colored regions correspond to the predicted transit time (with ±1σ errors) of planets d, f, 𝑔, and b according to the ephemerides from A22. The detrended CHEOPS data are represented by the light gray points, with their 5-min bins shown with the white dots. The black solid curve shows the fit of the four planet transits and arrows show the planets associated to each transit. Planet b is written in parentheses, as the depth of the event (~550 ppm) doesn't appear compatible with prior data (~250 ppm).
Current usage metrics show cumulative count of Article Views (full-text article views including HTML views, PDF and ePub downloads, according to the available data) and Abstracts Views on Vision4Press platform.
Data correspond to usage on the plateform after 2015. The current usage metrics is available 48-96 hours after online publication and is updated daily on week days.
Initial download of the metrics may take a while.