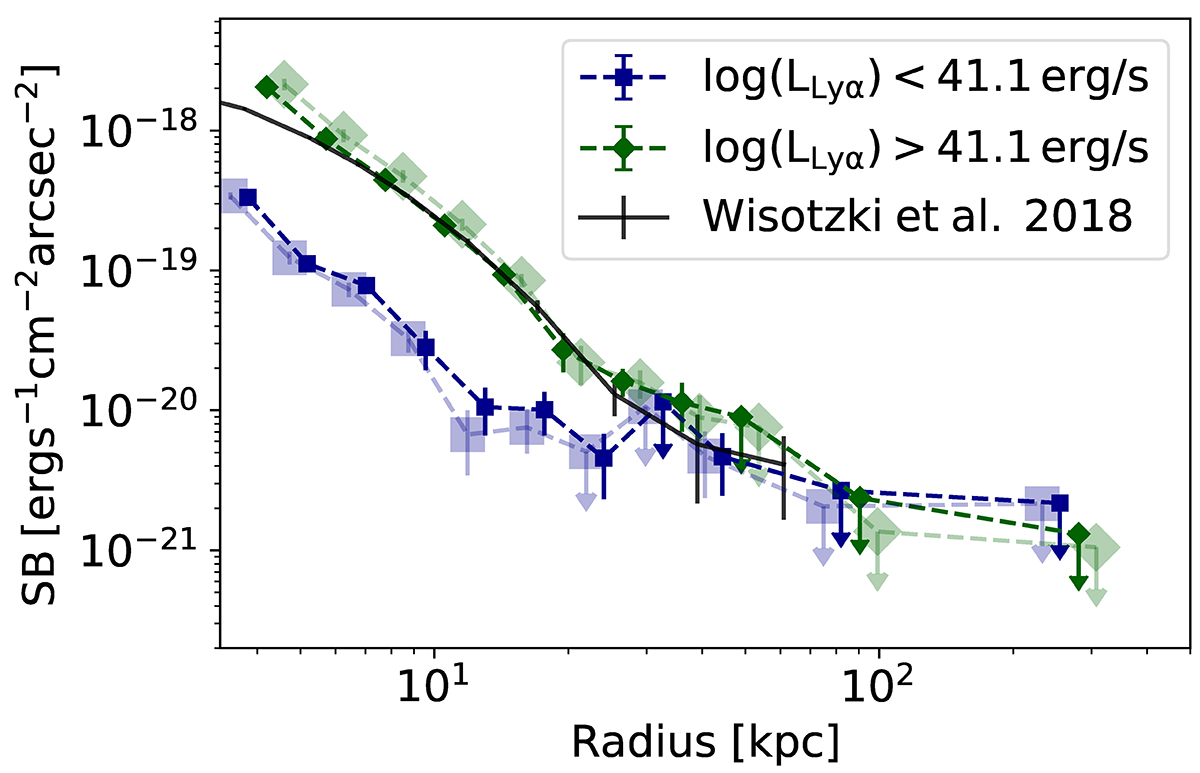
Fig. 6.
Download original image
Lyα surface-brightness profiles at 3 < z < 4. We split the LAE sample into two subsamples based on LLyα. The profiles before masking the neighbouring LAEs are shown by small symbols. The profiles after masking are shown by large, light-coloured symbols. For comparison, we also plot the result of Wisotzki et al. (2018). The symbols are slightly shifted horizontally for better visualisation.
Current usage metrics show cumulative count of Article Views (full-text article views including HTML views, PDF and ePub downloads, according to the available data) and Abstracts Views on Vision4Press platform.
Data correspond to usage on the plateform after 2015. The current usage metrics is available 48-96 hours after online publication and is updated daily on week days.
Initial download of the metrics may take a while.