Fig. 4.
Download original image
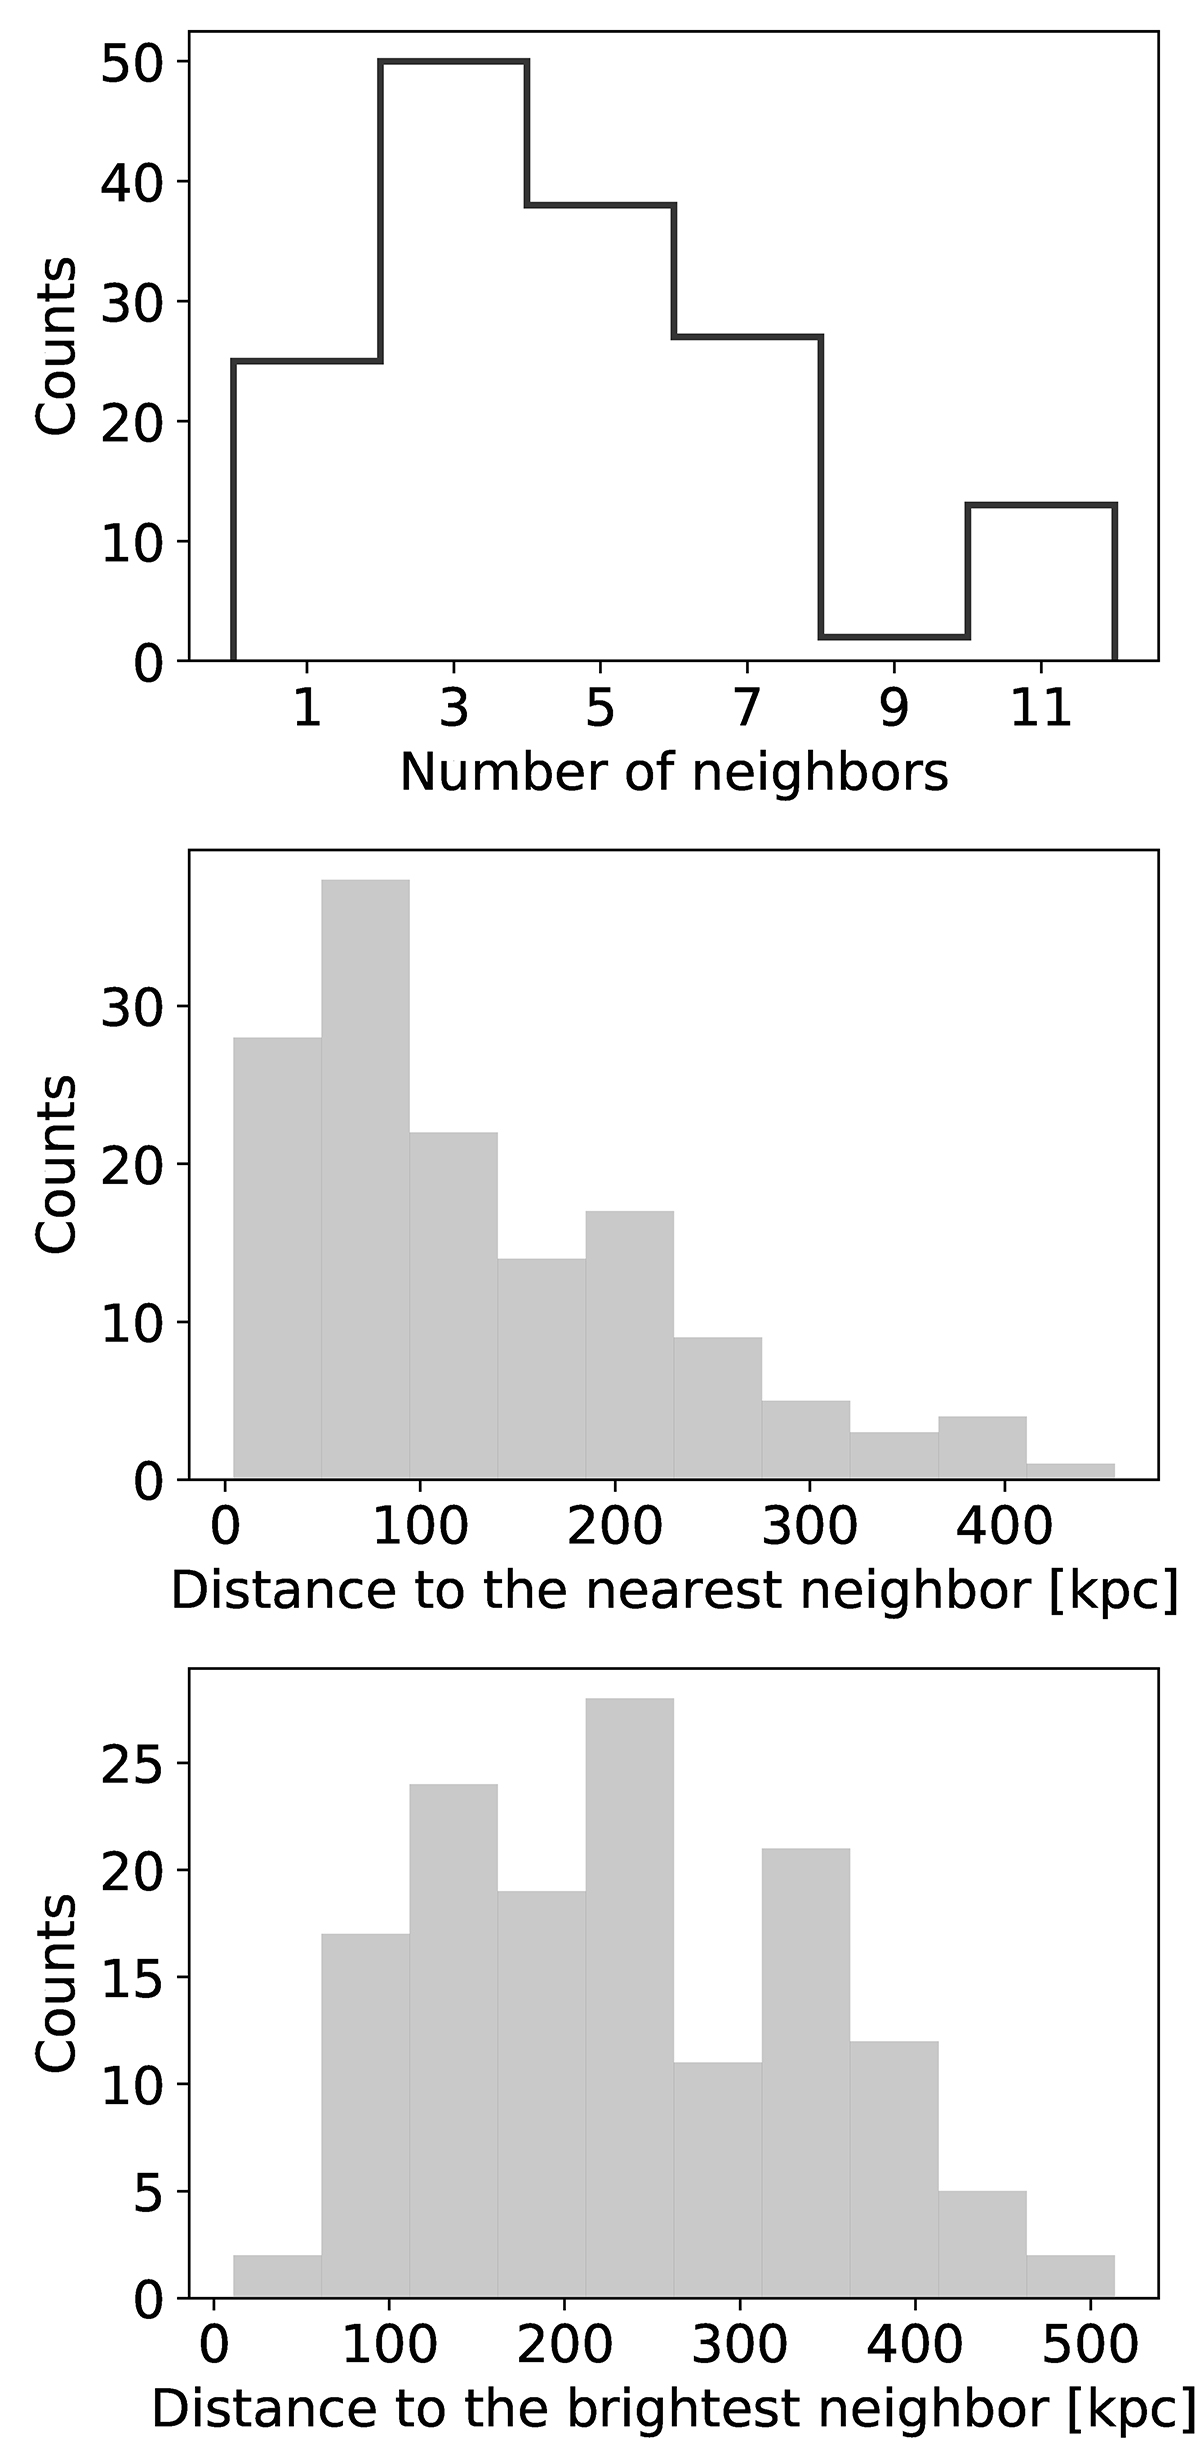
Distribution in upper panel presents number of neighbours detected within the MXDF field for each MXDF LAE at 3 < z < 4. The middle panel displays the projected distance to the nearest neighbour detected within the MXDF field of view. The lower panel displays the projected distance to the brightest neighbour detected within the MXDF field of view. All three panels are based on the MXDF galaxy catalogue (Bacon et al. 2023).
Current usage metrics show cumulative count of Article Views (full-text article views including HTML views, PDF and ePub downloads, according to the available data) and Abstracts Views on Vision4Press platform.
Data correspond to usage on the plateform after 2015. The current usage metrics is available 48-96 hours after online publication and is updated daily on week days.
Initial download of the metrics may take a while.