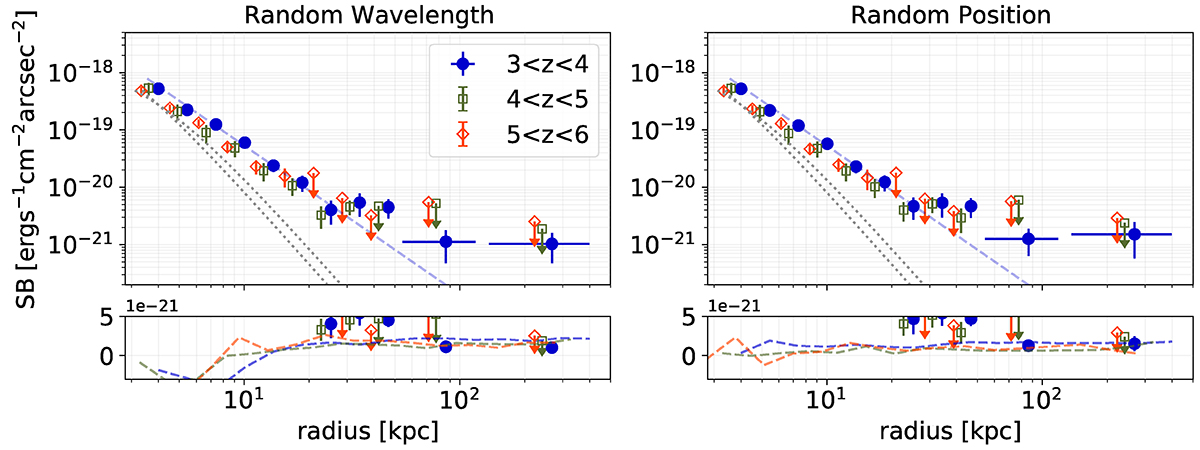
Fig. 3.
Download original image
Median Lyα surface-brightness profiles of our MXDF LAE sample after subtracting the systematic surface brightness offset. The left and right columns present the two methods for measuring the systematic offset (Sect. 2.4) by inserting fake objects at the same sky position as the real LAEs but in different wavelength layers (left column) and by inserting fake objects in the same wavelength layers but at different sky positions (right column). The blue dashed lines show the power-law fit. The small panels at the bottom show the systematic offset on a linear y scale. The final radial bin is centred at 270 kpc, but it includes signal out to ≈470 kpc. Different colours show different redshift ranges. All the symbols are slightly shifted horizontally for better visualisation. We plot the PSFs in the MXDF at 3000 Å and 9000 Å for comparison (dotted lines).
Current usage metrics show cumulative count of Article Views (full-text article views including HTML views, PDF and ePub downloads, according to the available data) and Abstracts Views on Vision4Press platform.
Data correspond to usage on the plateform after 2015. The current usage metrics is available 48-96 hours after online publication and is updated daily on week days.
Initial download of the metrics may take a while.