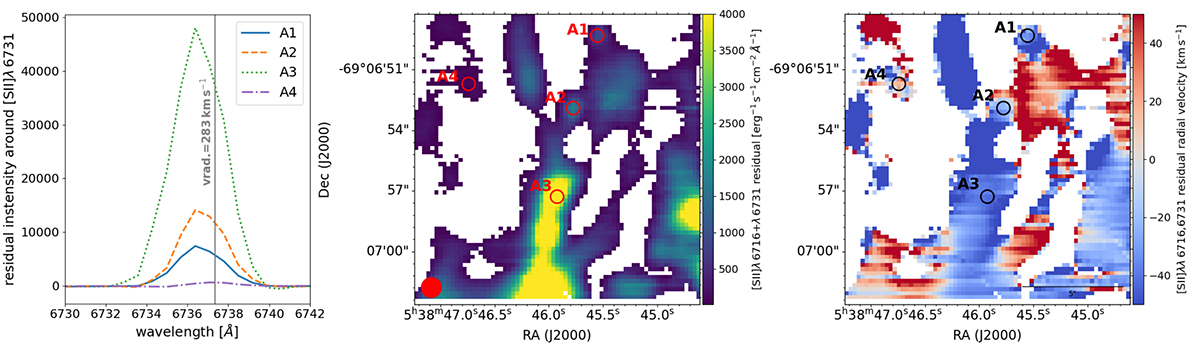
Fig. 5.
Download original image
Residual map in field A after NEBULISIER background filtering. Left panel: residual [S II] λ 6731 profiles extracted for each labeled target in field A with a 1″ aperture. The gray line marks the average radial velocity of the ISM in the field. Middle panel: residual intensity map of [S II] λλ 6716, 6731. Right panel: Average radial velocities of [S II] λλ 6716, 6731 lines. The targets listed in Table 1 are identified in both maps.
Current usage metrics show cumulative count of Article Views (full-text article views including HTML views, PDF and ePub downloads, according to the available data) and Abstracts Views on Vision4Press platform.
Data correspond to usage on the plateform after 2015. The current usage metrics is available 48-96 hours after online publication and is updated daily on week days.
Initial download of the metrics may take a while.