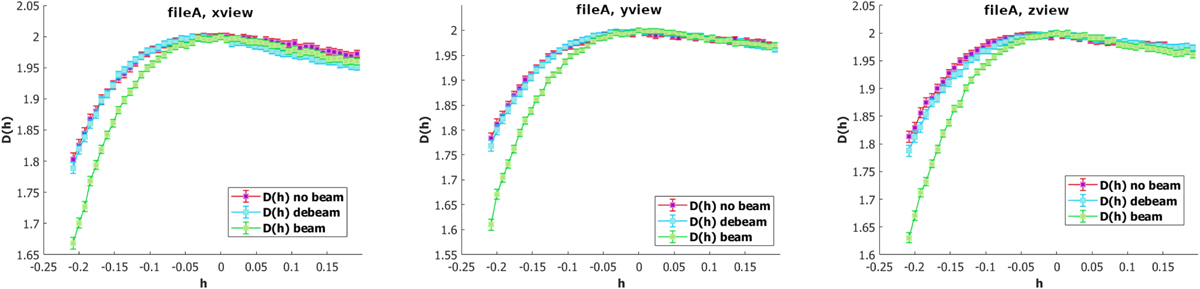
Fig. 6
Download original image
Beam reduction performed on simulation output fileA (see Table 1). In each image panel we show: the singularity spectrum of the data generated without any beam effect (called “no beam”, in red, and corresponding to a simulated “ground truth”), the singularity spectrum of the data generated with beam effect as described in the main text (2D Gaussian kernel of FWHM = 2 pixels, called “beam” in the graph, in green), and the singularity spectrum of the data after application of the proposed deconvolution algorithm (called “debeam”, in light blue). The left image panel shows the x view, filtered with p = 1.7 and λ = 0.1; the middle image panel displays the y view, filtered with p = 1.5 and λ = 0.1; and the right panel shows the z view, filtered with p = 1.4 and λ = 0.1.
Current usage metrics show cumulative count of Article Views (full-text article views including HTML views, PDF and ePub downloads, according to the available data) and Abstracts Views on Vision4Press platform.
Data correspond to usage on the plateform after 2015. The current usage metrics is available 48-96 hours after online publication and is updated daily on week days.
Initial download of the metrics may take a while.