Open Access
Fig. 26
Download original image
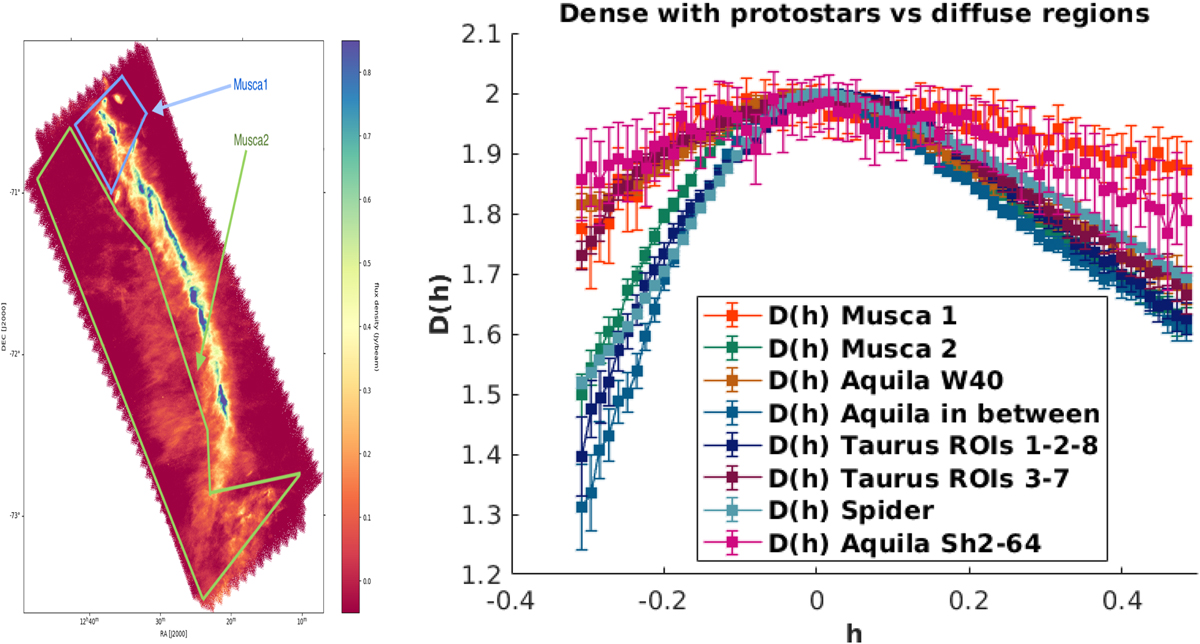
Dense regions with protostars vs diffuse regions. Left panel: definition of subregions Musca 1 and Musca 2. Right panel: left parts of singularity spectra (i.e., corresponding to h ≤ 0) clearly show two classes associated with diffuse regions and dense regions containing protostars.
Current usage metrics show cumulative count of Article Views (full-text article views including HTML views, PDF and ePub downloads, according to the available data) and Abstracts Views on Vision4Press platform.
Data correspond to usage on the plateform after 2015. The current usage metrics is available 48-96 hours after online publication and is updated daily on week days.
Initial download of the metrics may take a while.