Fig. 22
Download original image
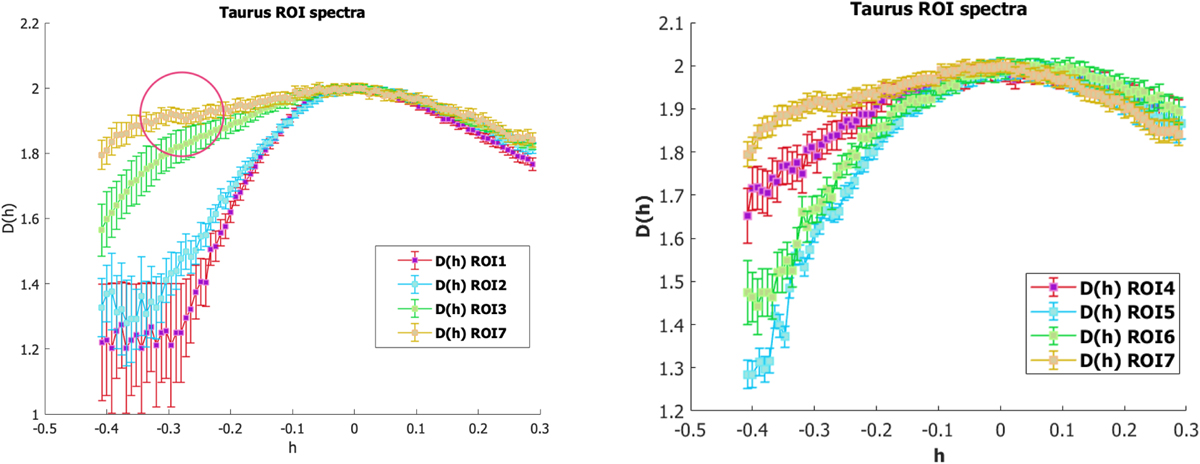
Different turbulent dynamics in the ROIs. Left panel: regions 1, 2, 3, and 7. Right panel: regions 4, 5, 6, and 7. The red circle in the left panel is placed over a possible inflexion point in the spectrum, which indicates at least two different types of turbulent dynamics in ROI 7, a finding that can be compared to the results of Li et al. (2021).
Current usage metrics show cumulative count of Article Views (full-text article views including HTML views, PDF and ePub downloads, according to the available data) and Abstracts Views on Vision4Press platform.
Data correspond to usage on the plateform after 2015. The current usage metrics is available 48-96 hours after online publication and is updated daily on week days.
Initial download of the metrics may take a while.