Open Access
Fig. 19
Download original image
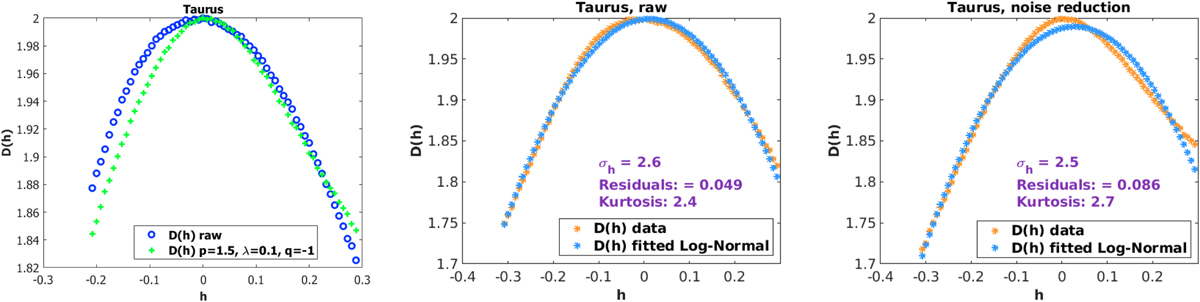
Taurus: singularity spectrum and noise reduction. Left panel: singularity spectra of Taurus L1495 observation map with and without noise reduction. Middle panel: log-normal fit to raw data. Right panel: log-normal fit after noise reduction: p = 1.5, q = −1, λ = 0.1.
Current usage metrics show cumulative count of Article Views (full-text article views including HTML views, PDF and ePub downloads, according to the available data) and Abstracts Views on Vision4Press platform.
Data correspond to usage on the plateform after 2015. The current usage metrics is available 48-96 hours after online publication and is updated daily on week days.
Initial download of the metrics may take a while.