Open Access
Fig. 14
Download original image
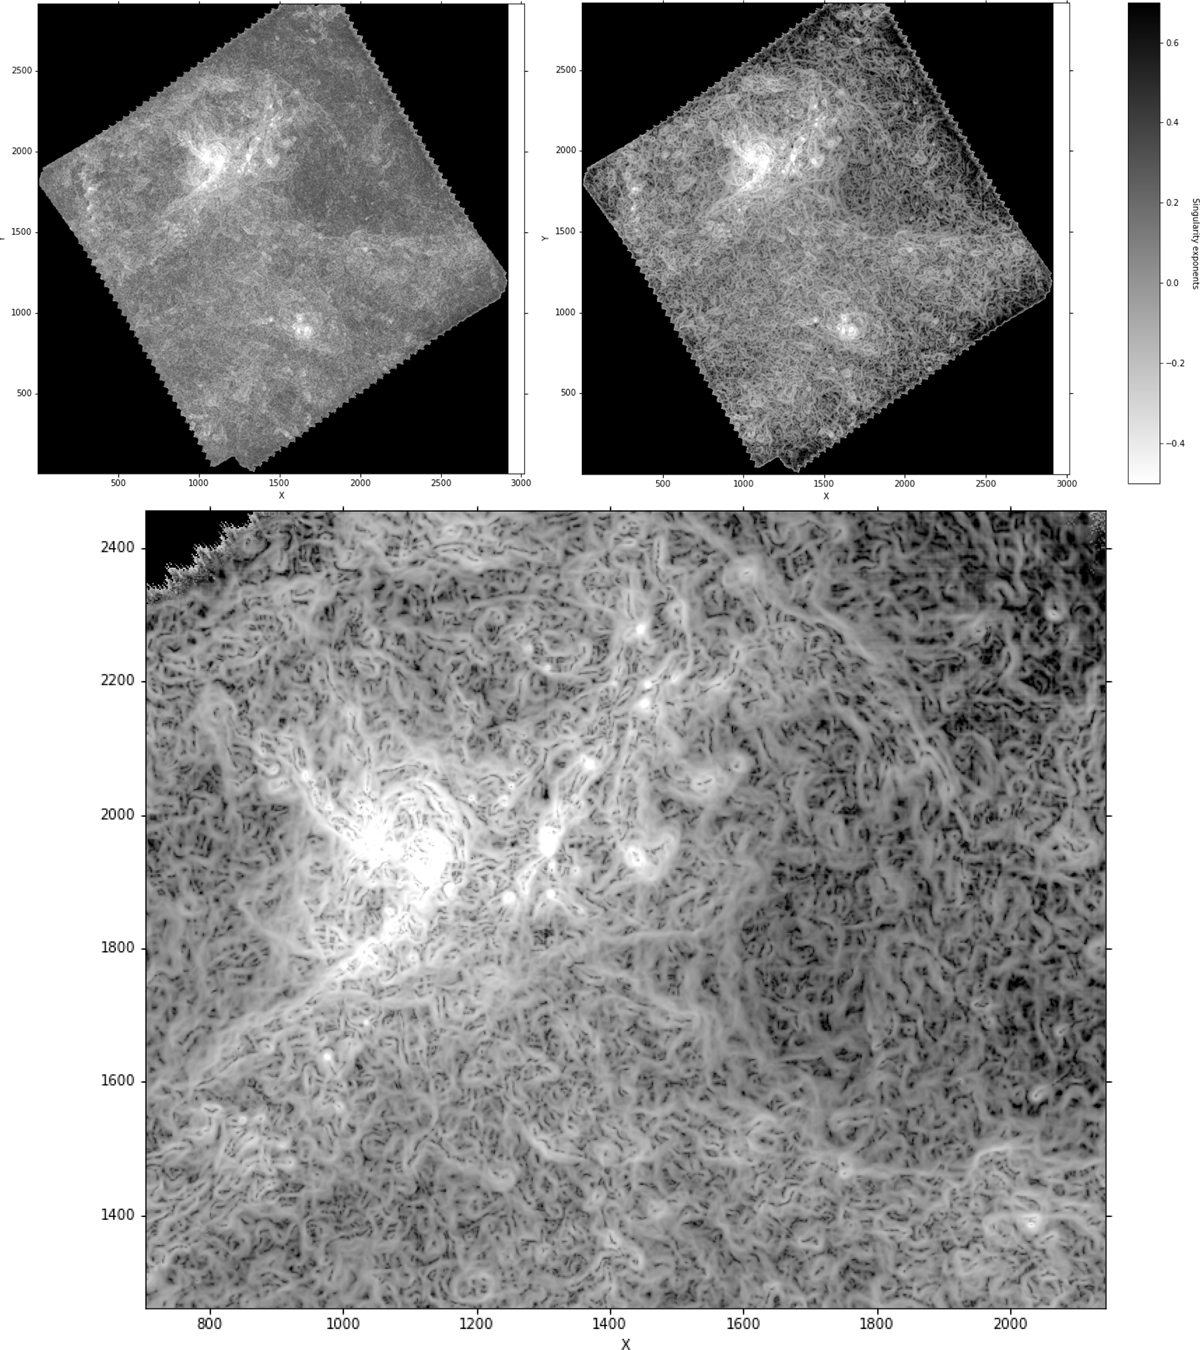
Noise reduction on Aquila. Top panel: singularity exponents of the Herschel observation of Aquila at 250 μm. Left image: display of the singularity exponents of the raw, unfiltered map. Right image: after noise reduction, p = 1.5, q = −1, λ = 0.1. Bottom panel: zoom on subregion of the filtered image.
Current usage metrics show cumulative count of Article Views (full-text article views including HTML views, PDF and ePub downloads, according to the available data) and Abstracts Views on Vision4Press platform.
Data correspond to usage on the plateform after 2015. The current usage metrics is available 48-96 hours after online publication and is updated daily on week days.
Initial download of the metrics may take a while.