Open Access
Fig. 3.
Download original image
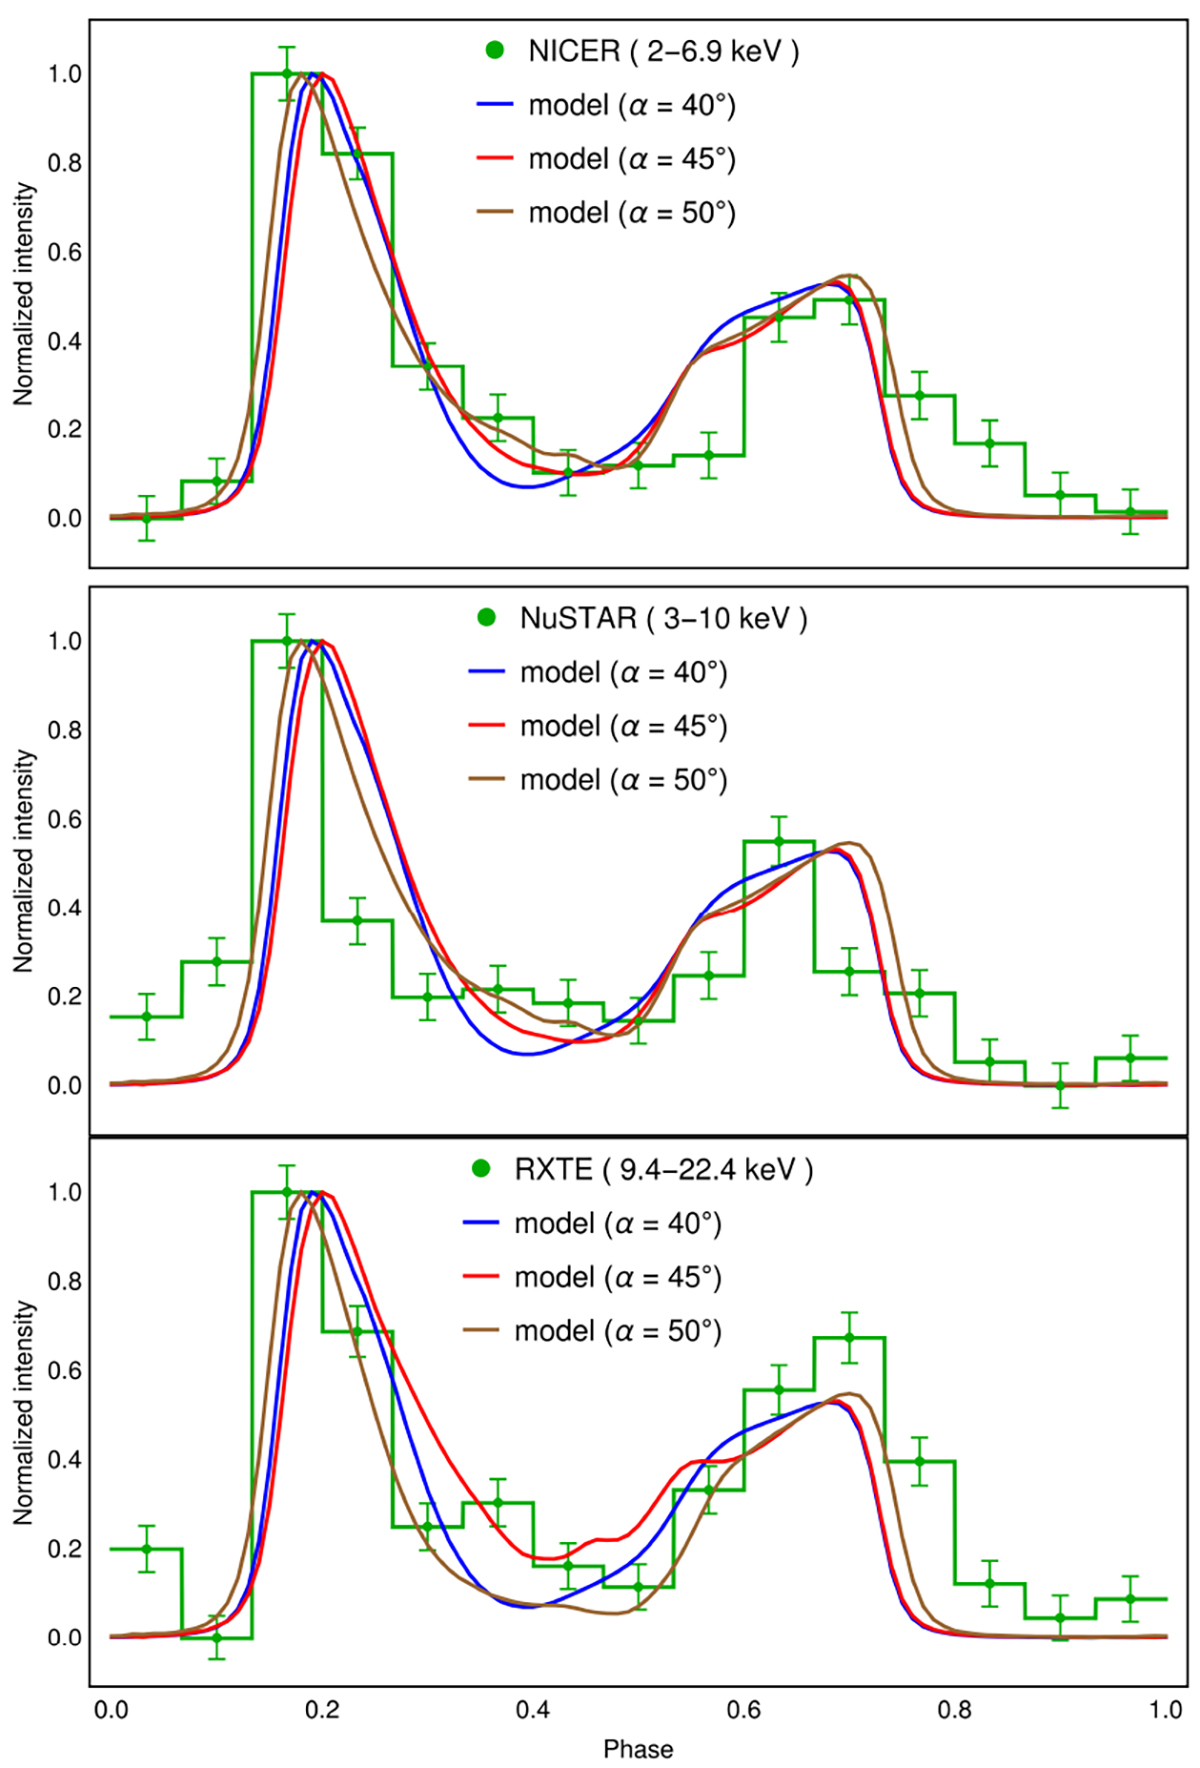
Best-fit light-curves in X-rays, using the NICER data (top); NuSTAR data (middle); and RXTE data (bottom). Observations are shown in green and the models in blue for (α, ζ) = (40° ,46° ), in red for (α, ζ) = (45° ,38° ), and in brown for (α, ζ) = (50° ,36° ).
Current usage metrics show cumulative count of Article Views (full-text article views including HTML views, PDF and ePub downloads, according to the available data) and Abstracts Views on Vision4Press platform.
Data correspond to usage on the plateform after 2015. The current usage metrics is available 48-96 hours after online publication and is updated daily on week days.
Initial download of the metrics may take a while.