Fig. 3.
Download original image
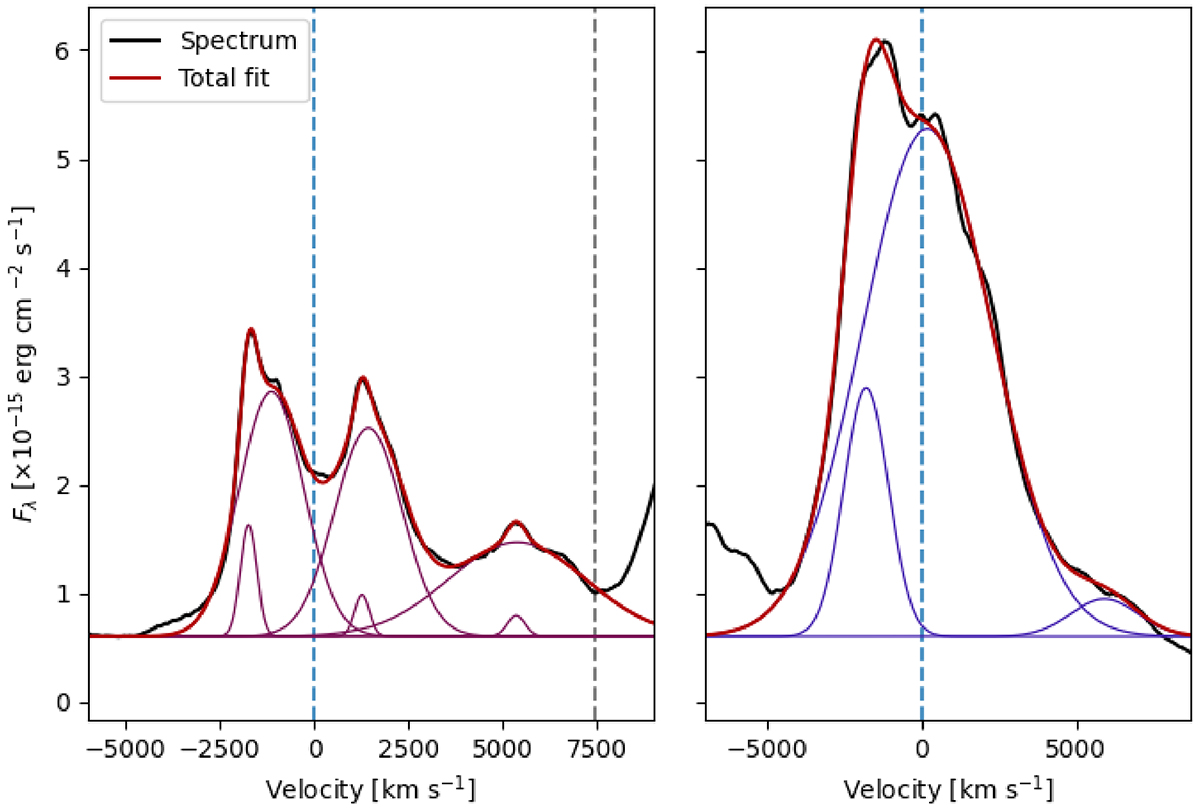
Fitting of the [O I] doublet and Hα profiles. Dashed blue lines indicate the rest wavelength for 6300 Å and 6564 Å in the left and right panels, respectively, and the dashed gray line indicates the rest wavelength for 6456 Å, which could be associated with O I or Fe II. The thin lines show the individual Gaussian components. See Sect. 3.2 for the interpretation of the line components.
Current usage metrics show cumulative count of Article Views (full-text article views including HTML views, PDF and ePub downloads, according to the available data) and Abstracts Views on Vision4Press platform.
Data correspond to usage on the plateform after 2015. The current usage metrics is available 48-96 hours after online publication and is updated daily on week days.
Initial download of the metrics may take a while.