Open Access
Fig. 1.
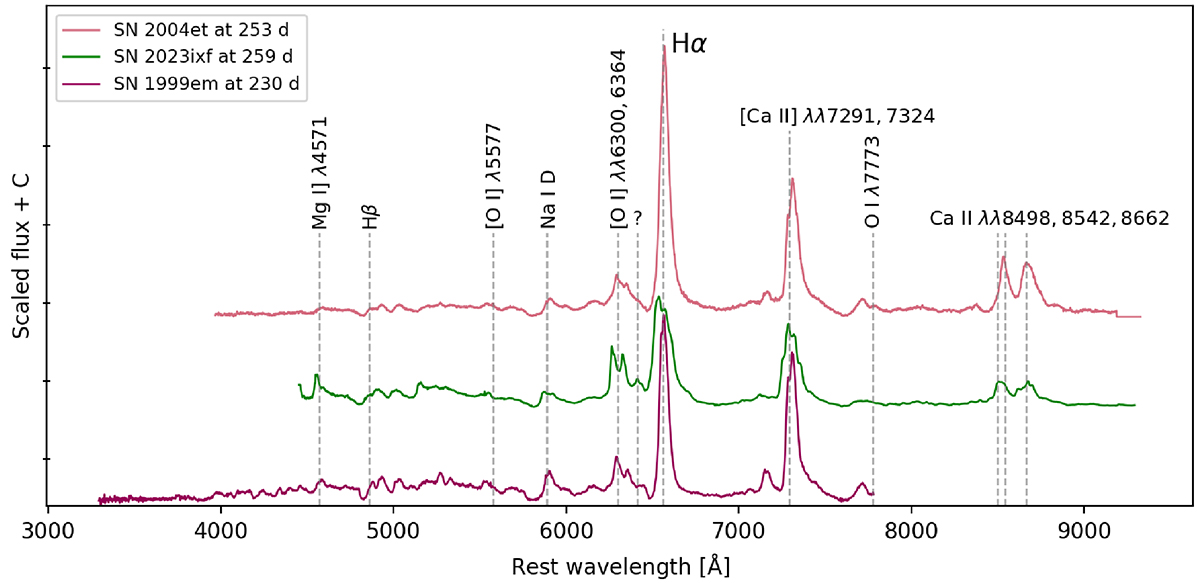
Download original image
Nebular spectra of SN 2023ixf compared with those of SN 1999em (Leonard et al. 2002) and SN 2004et (Sahu et al. 2006) at similar phases. The spectra are corrected for redshift and not extinction. Prominent emission features are indicated with gray vertical lines.
Current usage metrics show cumulative count of Article Views (full-text article views including HTML views, PDF and ePub downloads, according to the available data) and Abstracts Views on Vision4Press platform.
Data correspond to usage on the plateform after 2015. The current usage metrics is available 48-96 hours after online publication and is updated daily on week days.
Initial download of the metrics may take a while.