Fig. 3
Download original image
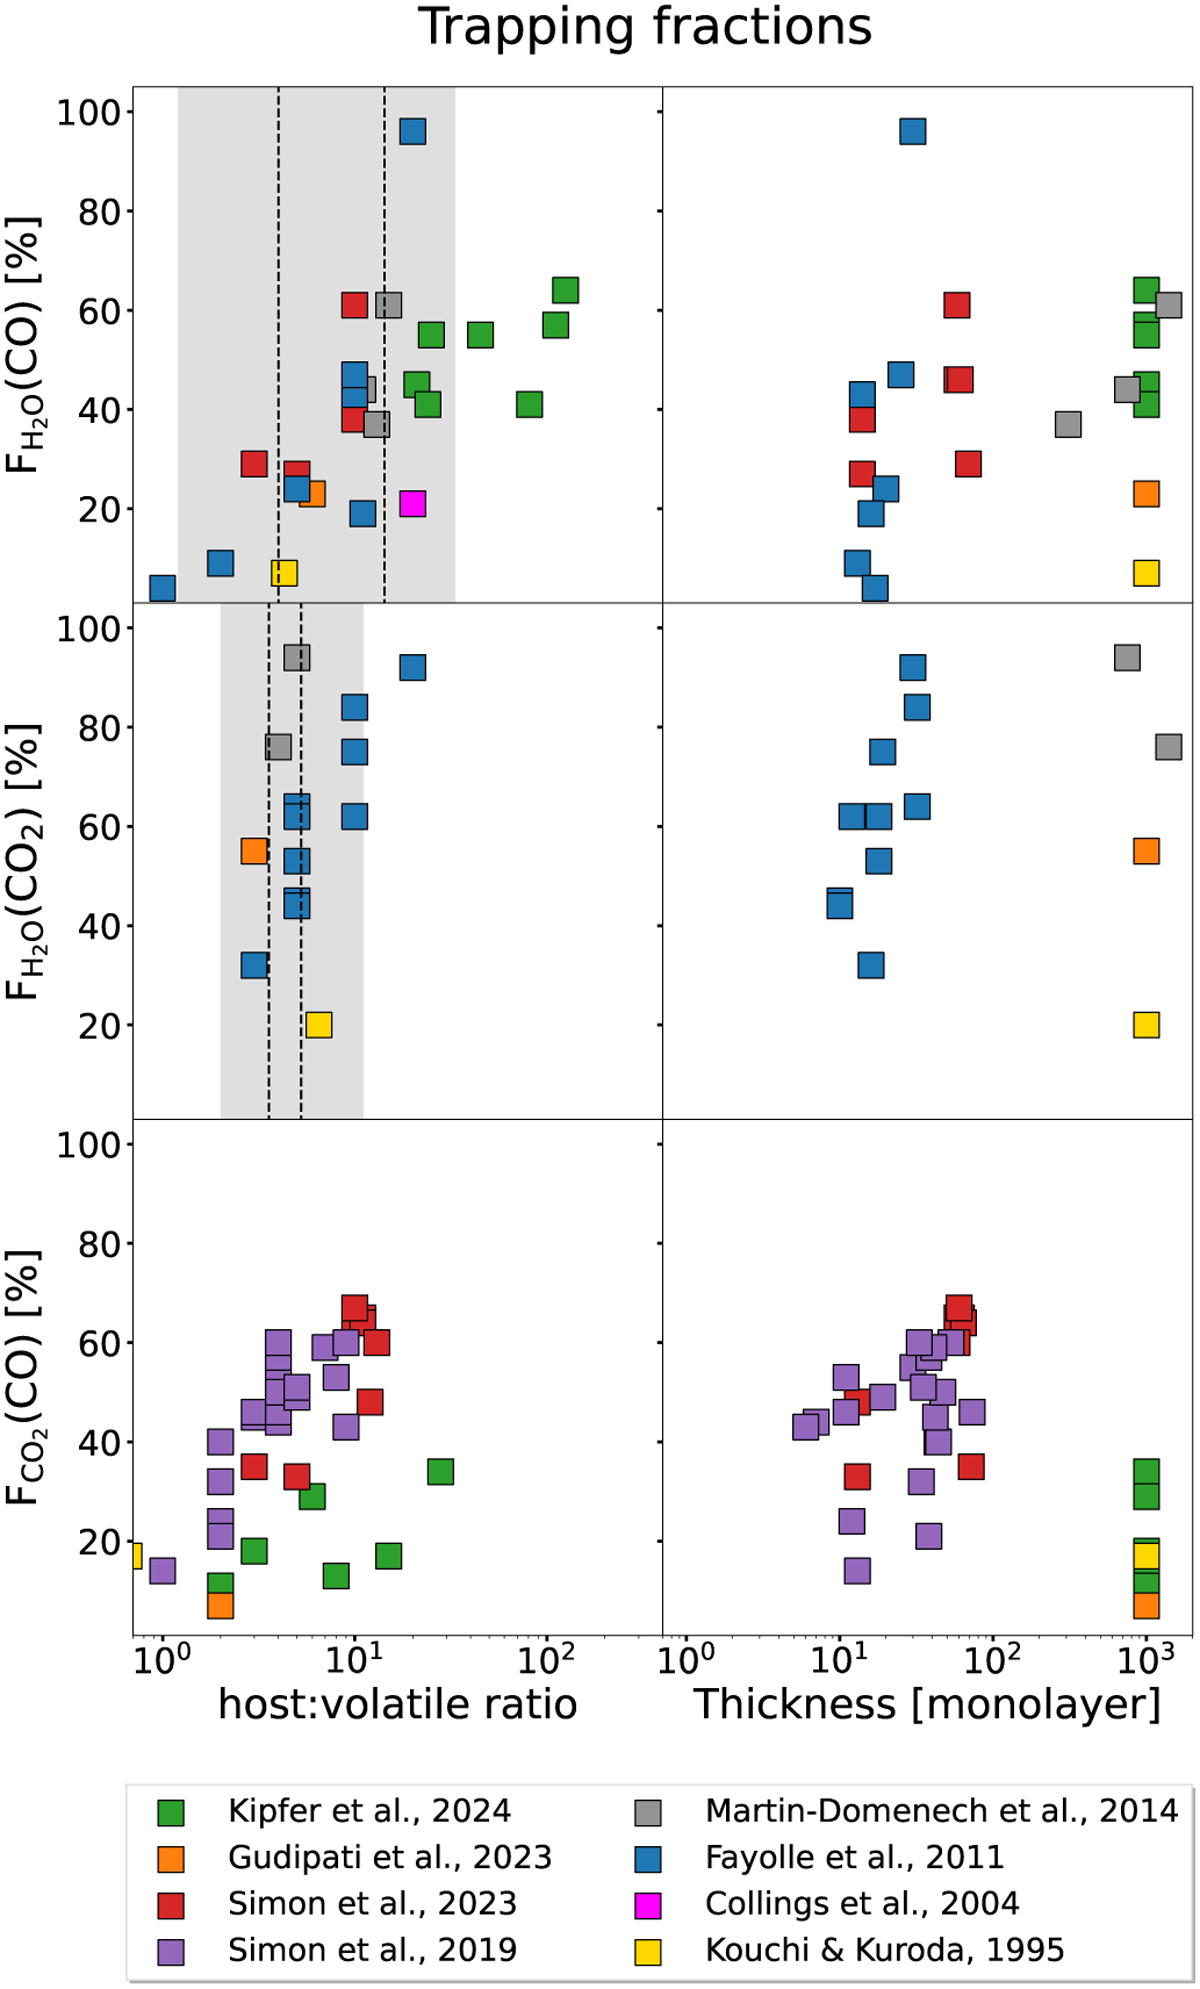
Trapping efficiencies of CO and CO2 in water (![]() (CO,CO2)), and CO in CO2 (
(CO,CO2)), and CO in CO2 (![]() (CO)) plotted against the host: volatile ice ratio (left) and the ice layer thickness (right). The thickness is given in monolayer (ML), where 1 ML = 1015 molecules cm−2. The grey shaded boxes show the H2O:CO and H2O:CO2 ice ratios observed in a variety of interstellar sources, while the dashed lines show their largest and smallest median values for data presented in Boogert et al. (2015). The laboratory data used in this plot are presented in Table A.1.
(CO)) plotted against the host: volatile ice ratio (left) and the ice layer thickness (right). The thickness is given in monolayer (ML), where 1 ML = 1015 molecules cm−2. The grey shaded boxes show the H2O:CO and H2O:CO2 ice ratios observed in a variety of interstellar sources, while the dashed lines show their largest and smallest median values for data presented in Boogert et al. (2015). The laboratory data used in this plot are presented in Table A.1.
Current usage metrics show cumulative count of Article Views (full-text article views including HTML views, PDF and ePub downloads, according to the available data) and Abstracts Views on Vision4Press platform.
Data correspond to usage on the plateform after 2015. The current usage metrics is available 48-96 hours after online publication and is updated daily on week days.
Initial download of the metrics may take a while.