Open Access
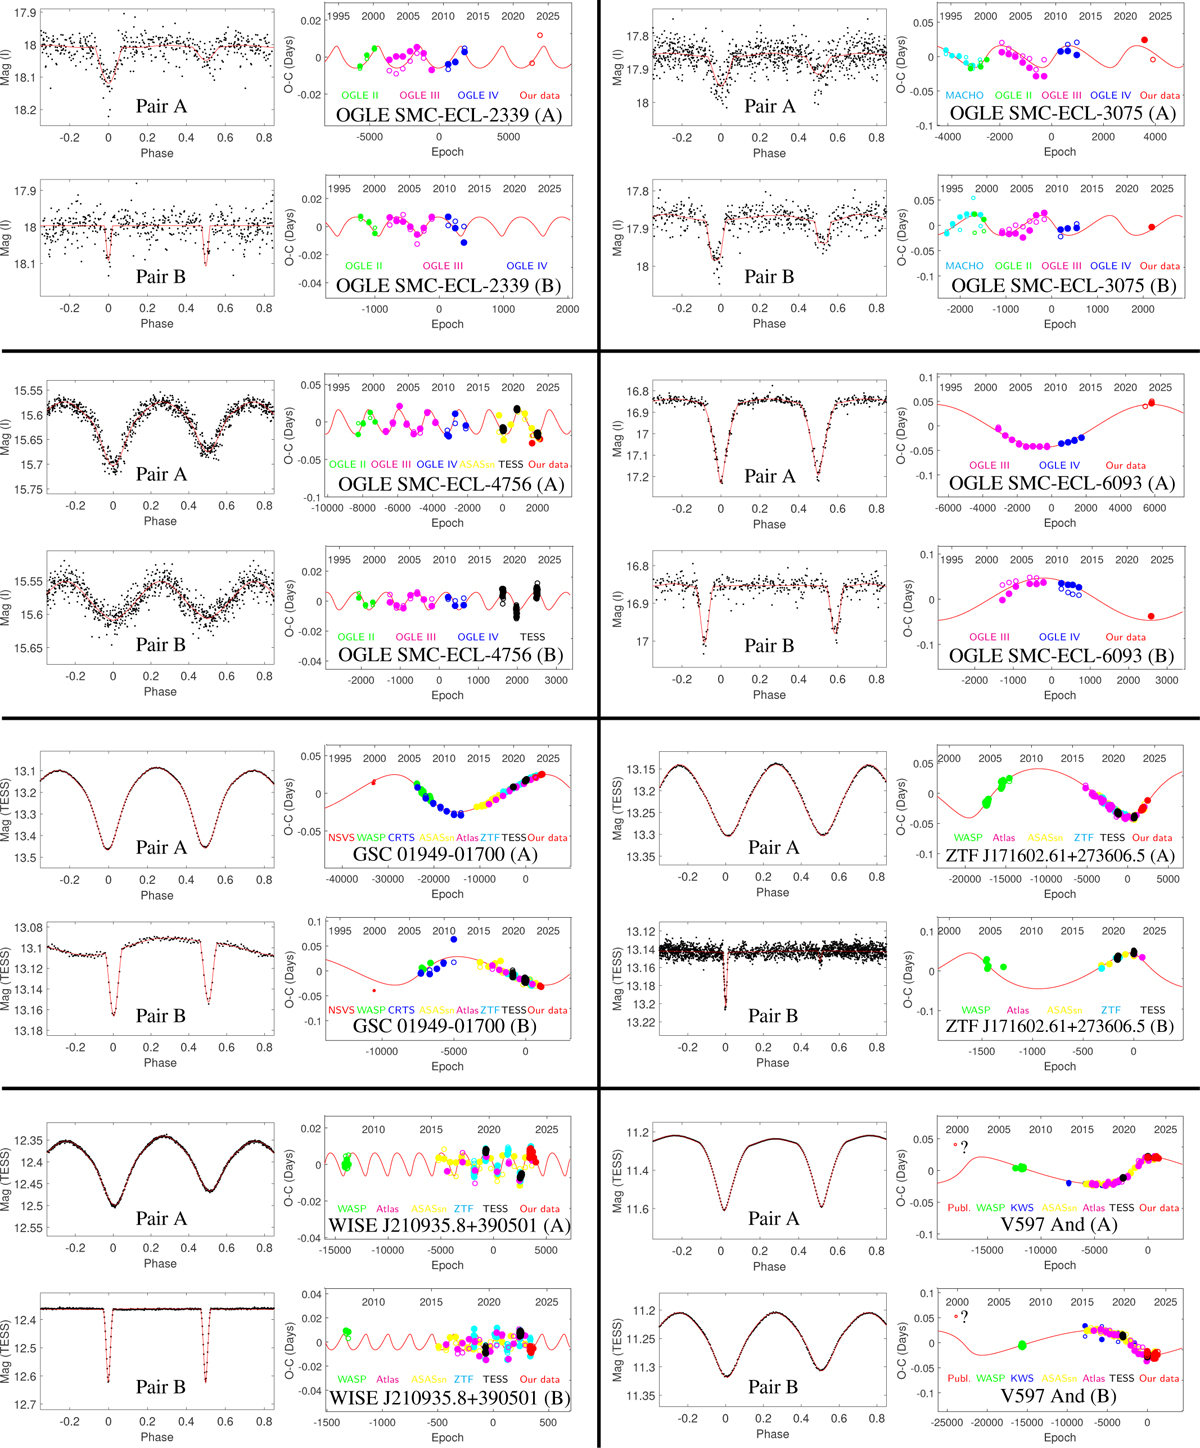
Fig. 1
Download original image
Fits for the LC and ETV data for both pairs for all of our analysed systems. Full dots denote the primary eclipses, open circles the secondary ones. Different sources of data points are distinguished by different colours.
Current usage metrics show cumulative count of Article Views (full-text article views including HTML views, PDF and ePub downloads, according to the available data) and Abstracts Views on Vision4Press platform.
Data correspond to usage on the plateform after 2015. The current usage metrics is available 48-96 hours after online publication and is updated daily on week days.
Initial download of the metrics may take a while.