Fig. 6.
Download original image
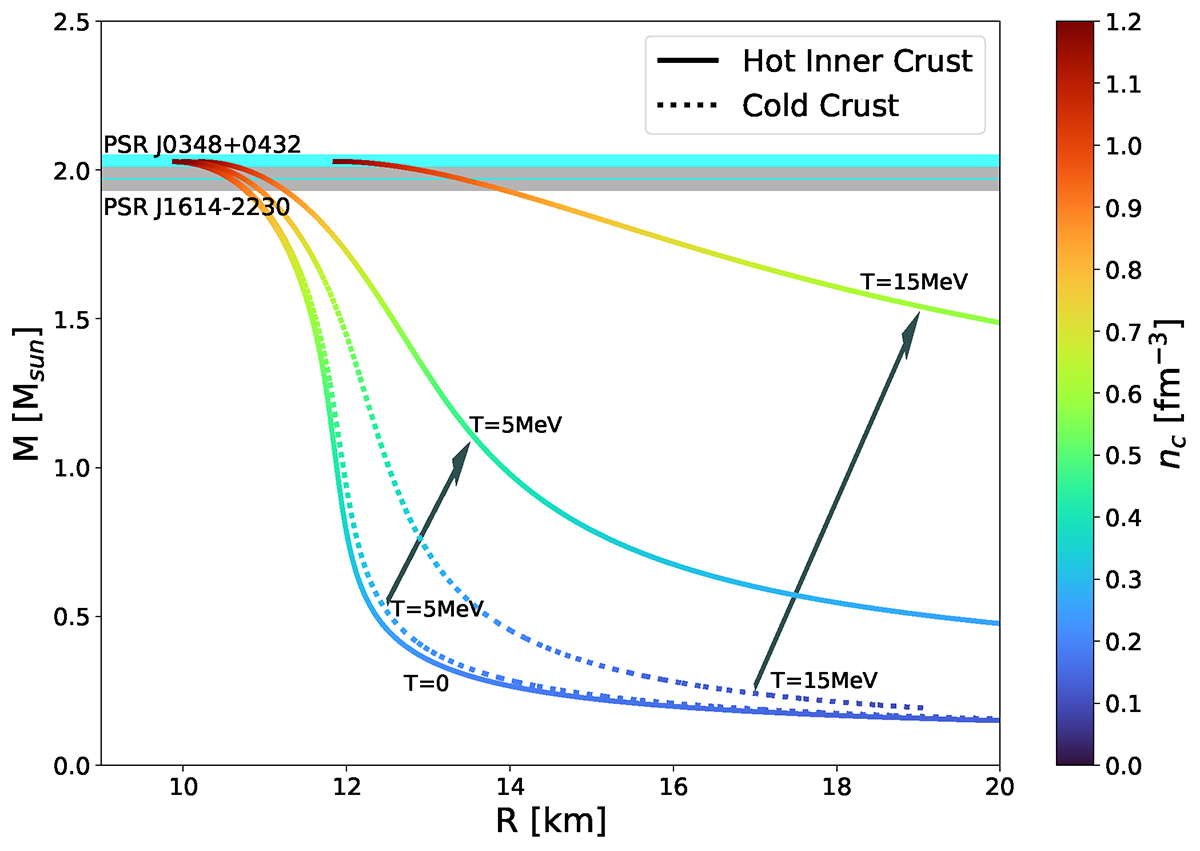
Mass–radius relations of NSs with an isothermal profile at temperatures of T = 0, 5, and 15 MeV. The dotted lines correspond to EOSs with cold crust and the solid lines correspond to EOSs with hot crust (the same as in Fig. 5). Note that the horizontal scale goes up to 20 km, whereas in Fig. 5 it goes up to 30 km. The observational constrains are the same as in Fig. 5. The two arrows indicate the shift in the M–R relation for T = 5 and T = 15 MeV.
Current usage metrics show cumulative count of Article Views (full-text article views including HTML views, PDF and ePub downloads, according to the available data) and Abstracts Views on Vision4Press platform.
Data correspond to usage on the plateform after 2015. The current usage metrics is available 48-96 hours after online publication and is updated daily on week days.
Initial download of the metrics may take a while.