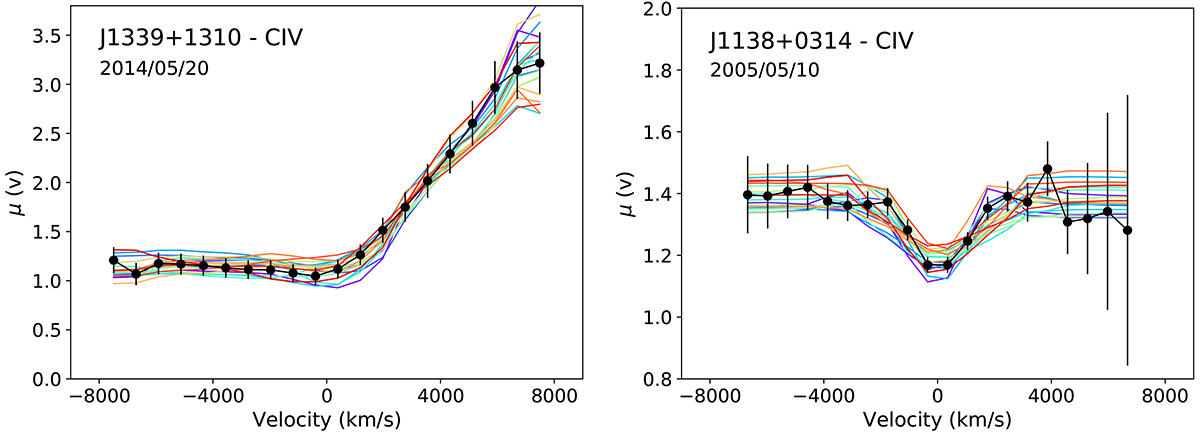
Fig. 3.
Download original image
Examples of 20 simulated μ(v) profiles (in color) that fit the μ(v) magnification profiles (in black) of the C IV emission line observed in J1339 (left) and J1138 (right). For J1339, the model is EW with rin = 0.1 rE, and the magnification map oriented at θ = 60°. For J1138, the model is KD with rin = 0.15 rE, θ = 0°, and μ(v) computed with M(C IV) = 0.9. For both models, i = 34°, q = 1.5, and rs = 0.1 rE.
Current usage metrics show cumulative count of Article Views (full-text article views including HTML views, PDF and ePub downloads, according to the available data) and Abstracts Views on Vision4Press platform.
Data correspond to usage on the plateform after 2015. The current usage metrics is available 48-96 hours after online publication and is updated daily on week days.
Initial download of the metrics may take a while.