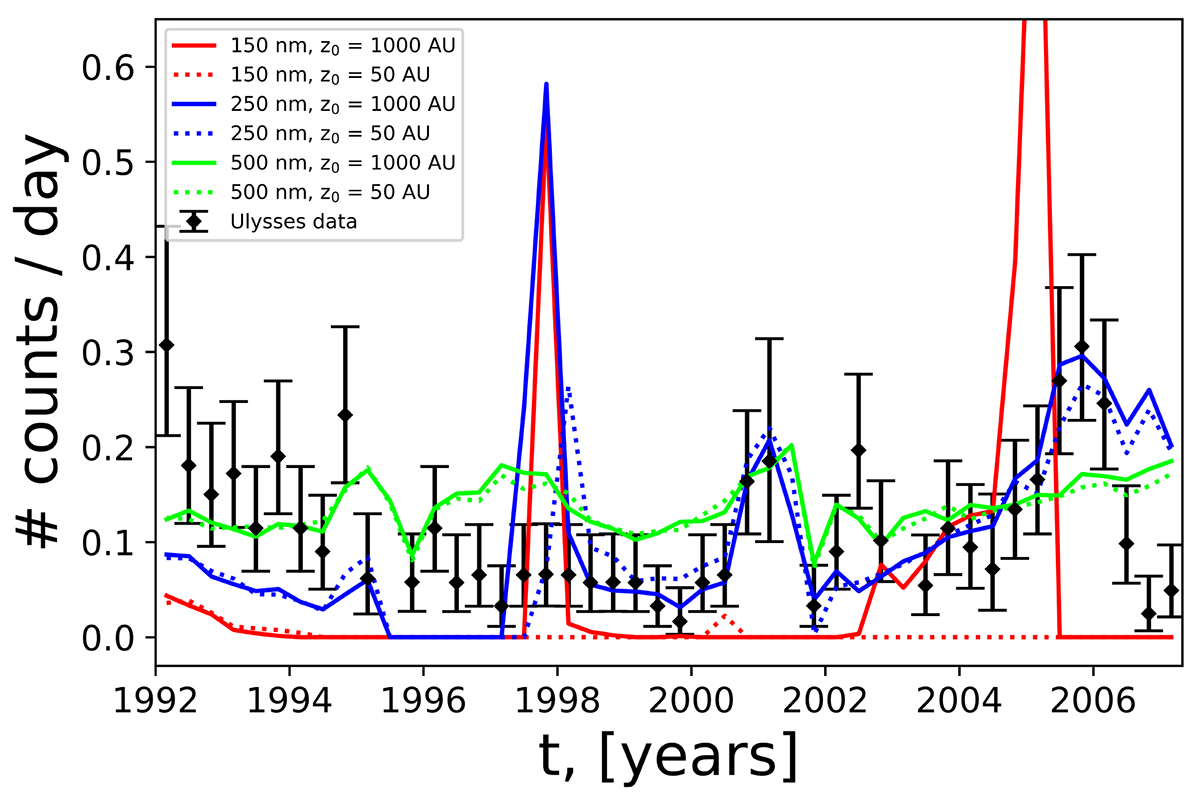
Fig. 2.
Download original image
Counts per day on Ulysses for particles of different sizes for the two models with (Z0 = 1000 AU, model 1; solid lines) and without (Z0 = 50 AU, model 2; dotted lines) the heliospheric interface. The different colors match particles of different sizes: a = 150 nm (red lines, β = 1.595), a = 250 nm (blue lines, β = 1.264), and a = 500 nm (green lines, β = 0.639). The black points are the Ulysses experimental counts.
Current usage metrics show cumulative count of Article Views (full-text article views including HTML views, PDF and ePub downloads, according to the available data) and Abstracts Views on Vision4Press platform.
Data correspond to usage on the plateform after 2015. The current usage metrics is available 48-96 hours after online publication and is updated daily on week days.
Initial download of the metrics may take a while.