Fig. C.2.
Download original image
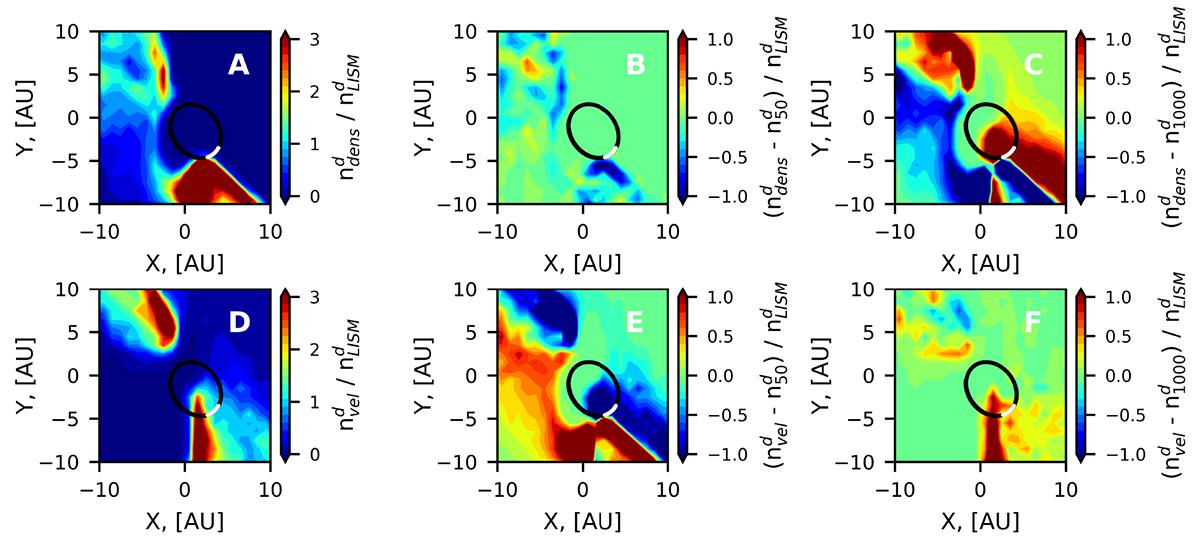
Number density distributions for a = 150 nm ISD particles in the plane Z = 0 in 2004 − 2005 when we start their motion from the plane Z = 50 AU with the given number density (panel A) or given velocity (panel D) distribution. Panels B and C correspond to the difference between the results from panel A and the results presented in Fig. 3 (models 2 and 1, respectively). Panels E and F show the analogical difference for the results from panel D.
Current usage metrics show cumulative count of Article Views (full-text article views including HTML views, PDF and ePub downloads, according to the available data) and Abstracts Views on Vision4Press platform.
Data correspond to usage on the plateform after 2015. The current usage metrics is available 48-96 hours after online publication and is updated daily on week days.
Initial download of the metrics may take a while.