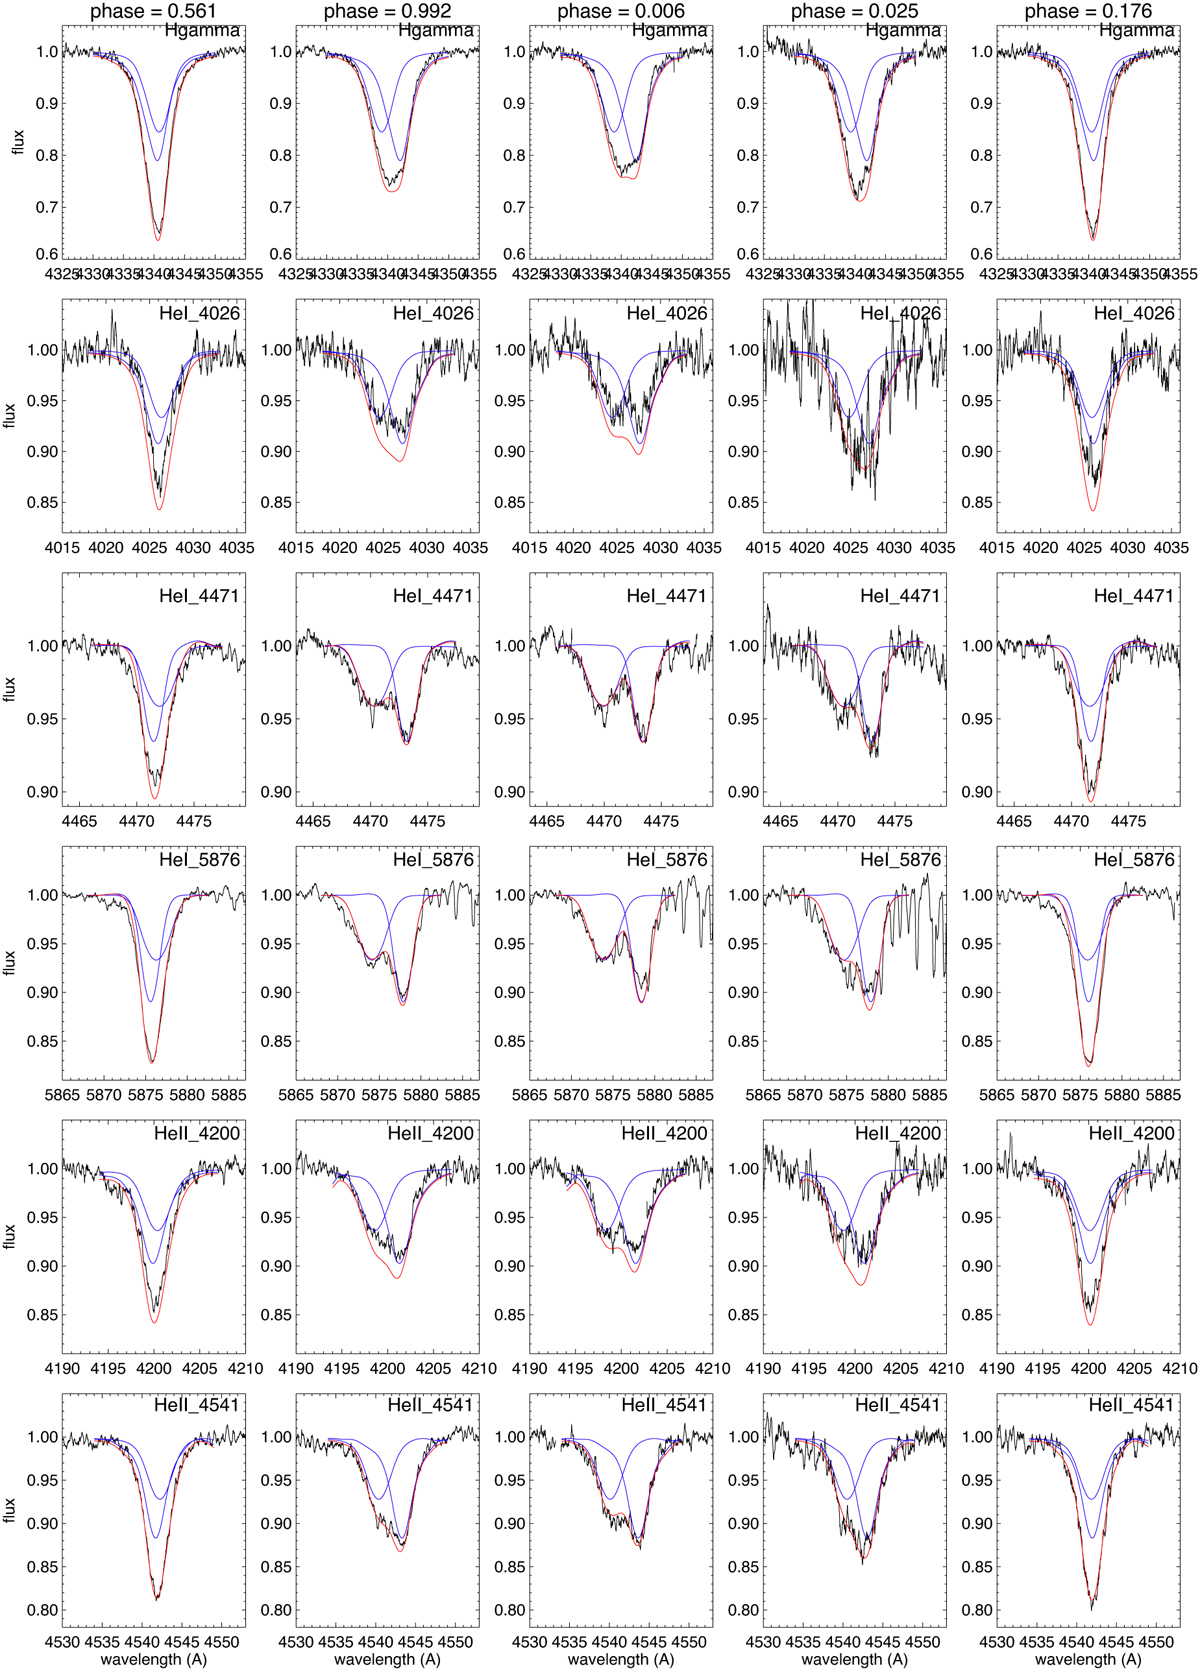
Fig. B.1
Download original image
Best fit to the spectral lines for a selection of orbital phases, using the stellar parameters from Table 3. Each column shows an orbital phase (listed at the top), each row shows a spectral line (listed inside each plot). The observed spectrum is given by the black curve, the theoretical fits of each of the two components by the blue curves, and the combined fit by the red curve.
Current usage metrics show cumulative count of Article Views (full-text article views including HTML views, PDF and ePub downloads, according to the available data) and Abstracts Views on Vision4Press platform.
Data correspond to usage on the plateform after 2015. The current usage metrics is available 48-96 hours after online publication and is updated daily on week days.
Initial download of the metrics may take a while.