Fig. A.1
Download original image
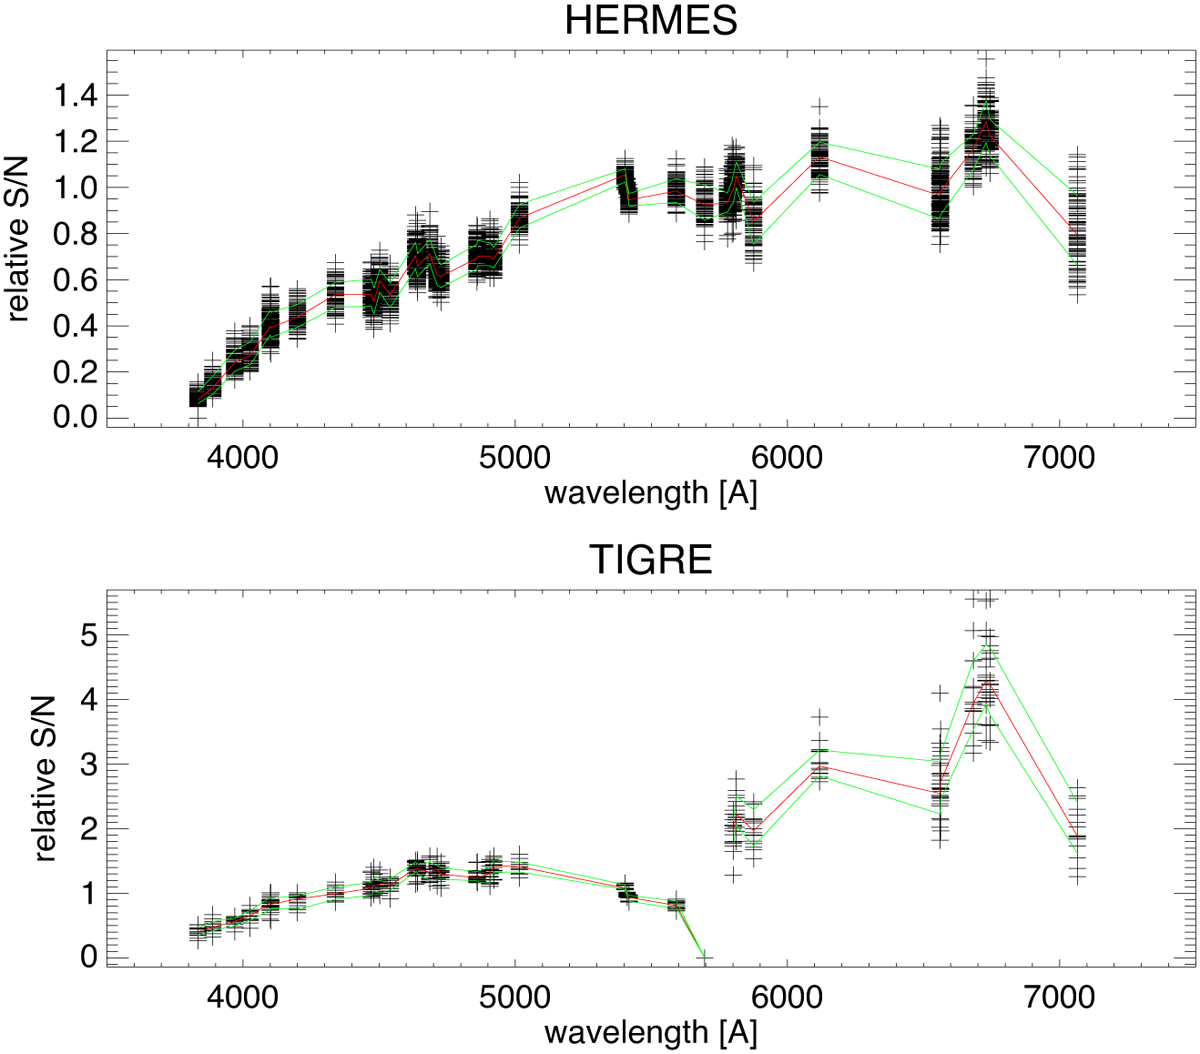
Relative signal-to-noise ratio (S/N) as a function of the wavelength for the HERMES (top panel) and the TIGRE (bottom panel) spectra. The S/N is relative to the S/N at 5410 Å, with the 5410 Å value being listed in Table A.1. At a given wavelength, the multiple crosses show the value of the individual spectra for the spectral line. The red line gives the median of these values, and the green lines the range that contains 68.3% of the data. The break in the TIGRE data around 5700 Å is due to the change from the blue arm to the red arm (Schmitt et al. 2014).
Current usage metrics show cumulative count of Article Views (full-text article views including HTML views, PDF and ePub downloads, according to the available data) and Abstracts Views on Vision4Press platform.
Data correspond to usage on the plateform after 2015. The current usage metrics is available 48-96 hours after online publication and is updated daily on week days.
Initial download of the metrics may take a while.