Fig. 2
Download original image
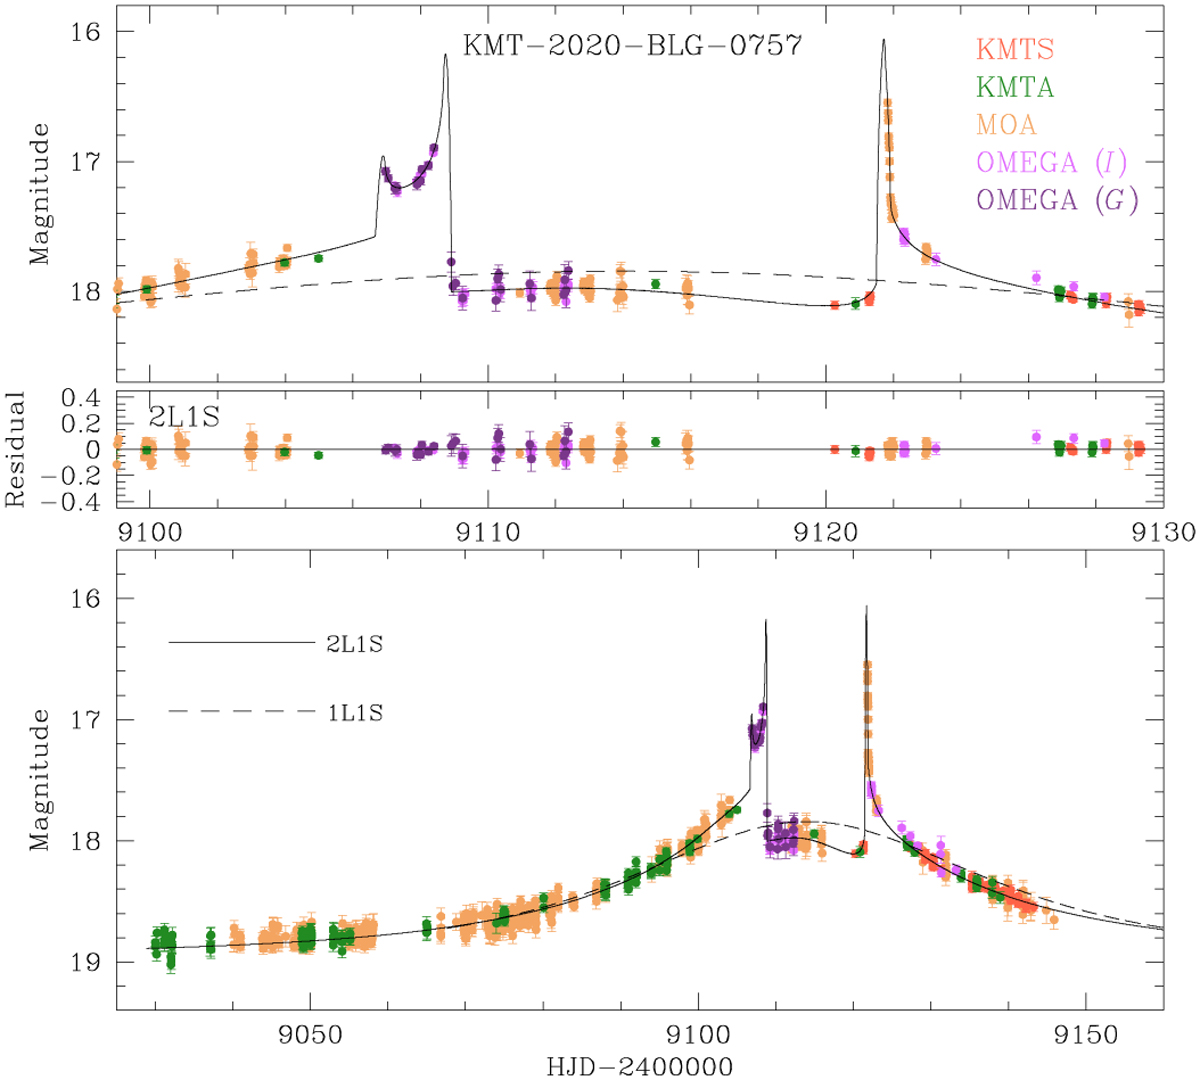
Light curve and models of KMT-2020-BLG-0757. The lower panel provides an overall view, while the top panel offers a zoomed-in perspective of the peak region. The dotted and solid lines represent models for the inner and outer planetary solutions, respectively. Below the top panel, two additional panels display residuals from these solutions. The dashed curve corresponds to the single-lens single-source (1L1S) model.
Current usage metrics show cumulative count of Article Views (full-text article views including HTML views, PDF and ePub downloads, according to the available data) and Abstracts Views on Vision4Press platform.
Data correspond to usage on the plateform after 2015. The current usage metrics is available 48-96 hours after online publication and is updated daily on week days.
Initial download of the metrics may take a while.