Fig. A.1.
Download original image
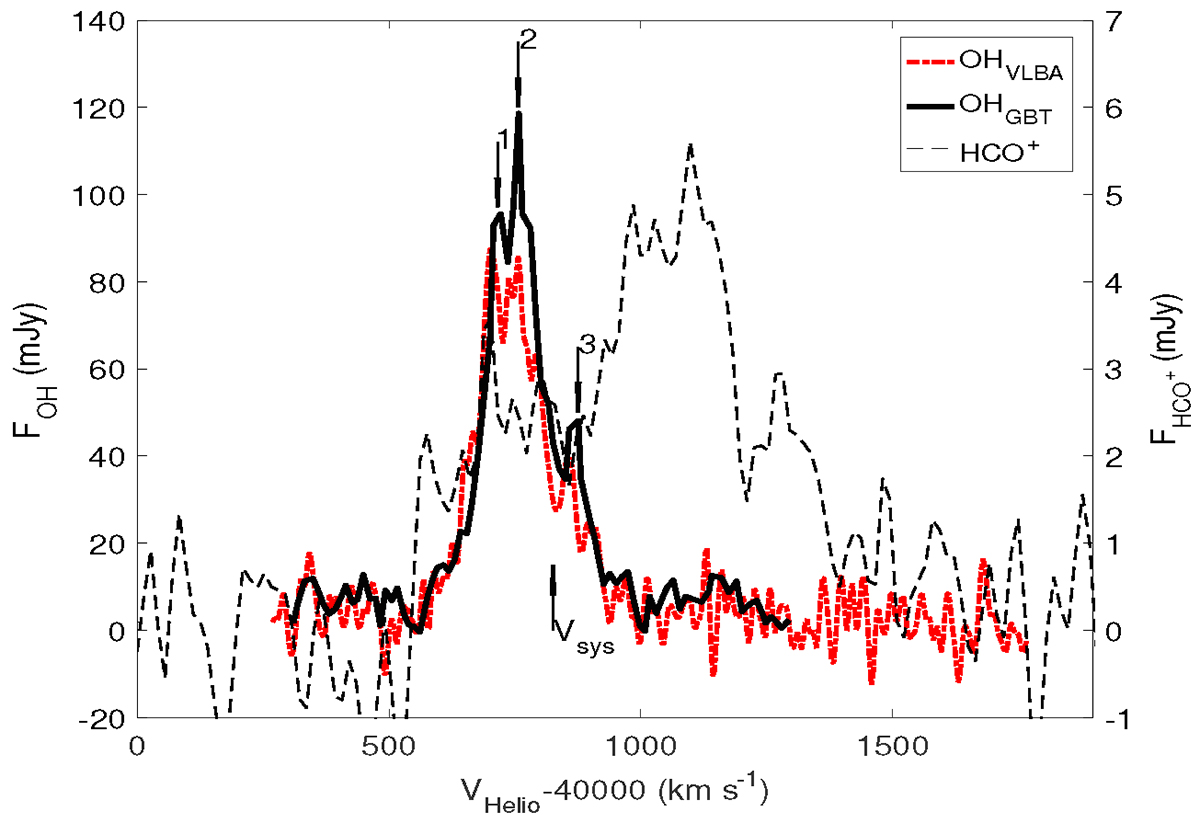
Line profiles of OH and HCO+. The OH line profile obtained from GBT observations by Willett (2012) is represented by the solid line. The red, dash-doted line represents the integrated VLBA OH line profile extracted from a square region measuring about 50 × 50 mas centred at RA:01 32 21.415 DEC:-07 29 08.347, which has been smoothed to about 20 km s−1. The three downward arrows represent the three peaks of the OH emission profile. The HCO+ line profiles obtained from ALMA observations (project: 2017.1.00057.S) are depicted by the dashed black line, which was generated in a circular region (radius ∼ 150 mas) and has been smoothed to 45 km s−1. The upward arrow corresponds to the optical system velocity c*z (z = 0.1362 Soto & Martin (2012)). The y-axis of the OH lines is on the left, whereas the y-axis of the other lines is on the right in both panels.
Current usage metrics show cumulative count of Article Views (full-text article views including HTML views, PDF and ePub downloads, according to the available data) and Abstracts Views on Vision4Press platform.
Data correspond to usage on the plateform after 2015. The current usage metrics is available 48-96 hours after online publication and is updated daily on week days.
Initial download of the metrics may take a while.