Open Access
Fig. 5.
Download original image
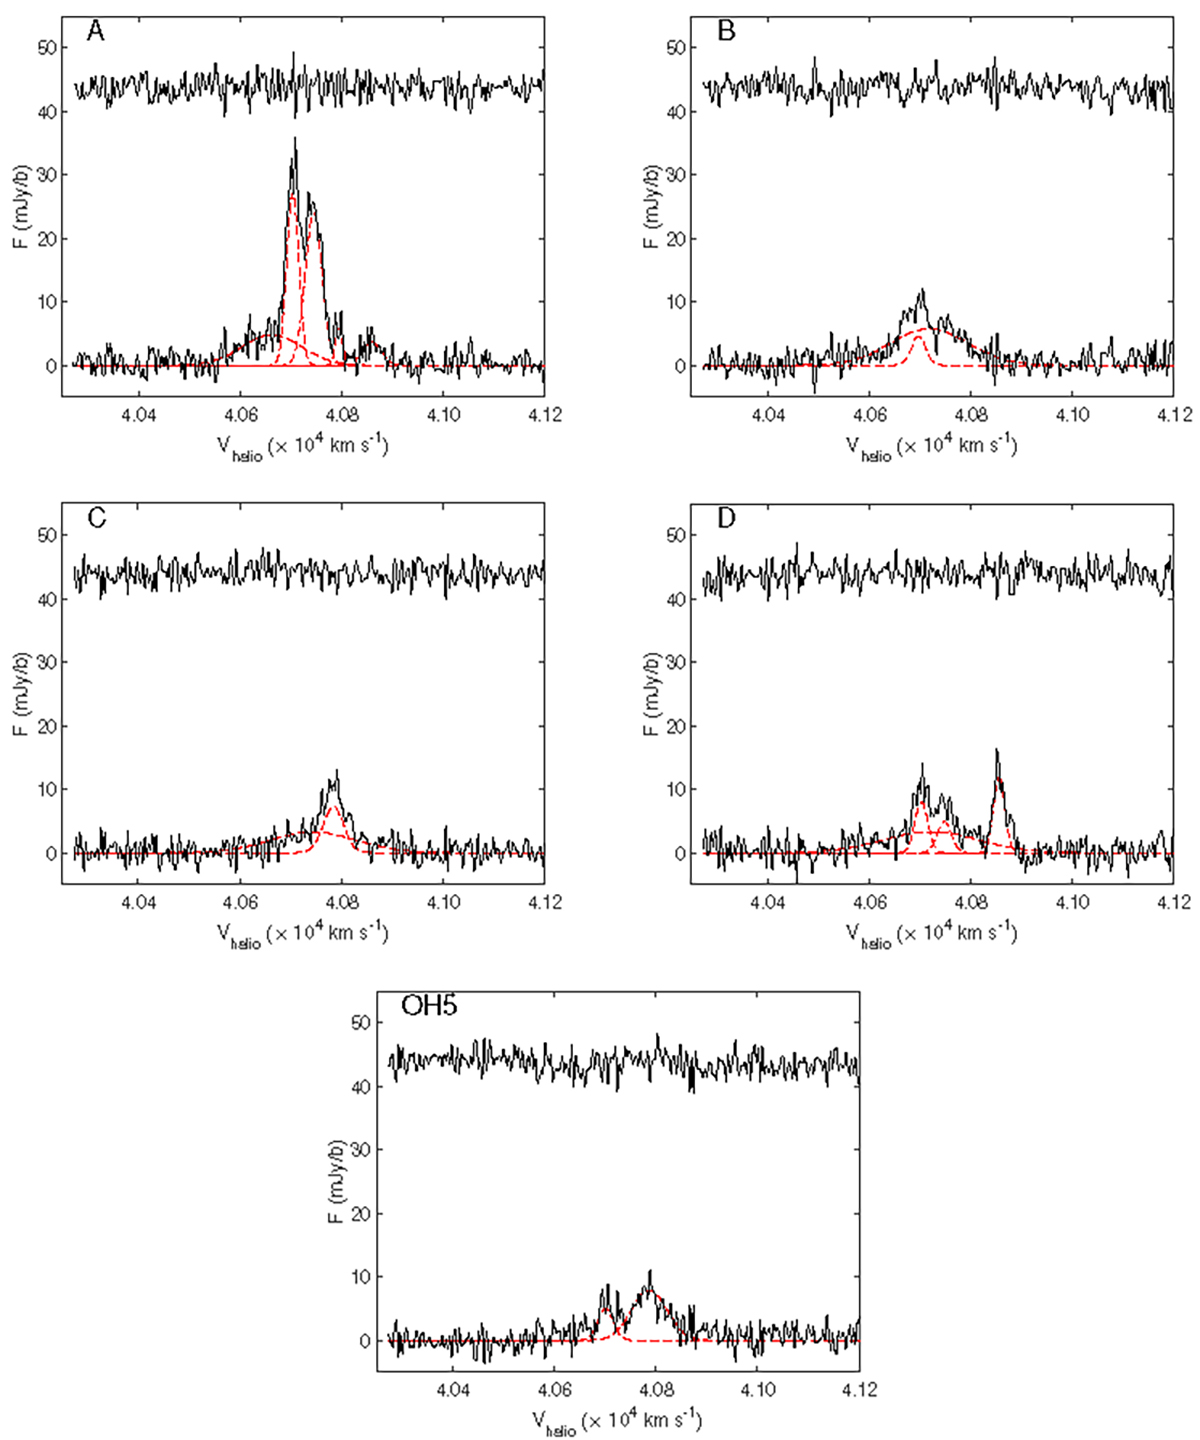
OH emission lines extracted at four bright compact spots of IRAS 01298−0744 (see Fig. 4). The OH line profiles are fitted with two or more Gaussian components, and the upper spectrum of each panel shows the residual spectrum (data-model), which are plotted with an offset (+44 mJy) for clarity.
Current usage metrics show cumulative count of Article Views (full-text article views including HTML views, PDF and ePub downloads, according to the available data) and Abstracts Views on Vision4Press platform.
Data correspond to usage on the plateform after 2015. The current usage metrics is available 48-96 hours after online publication and is updated daily on week days.
Initial download of the metrics may take a while.