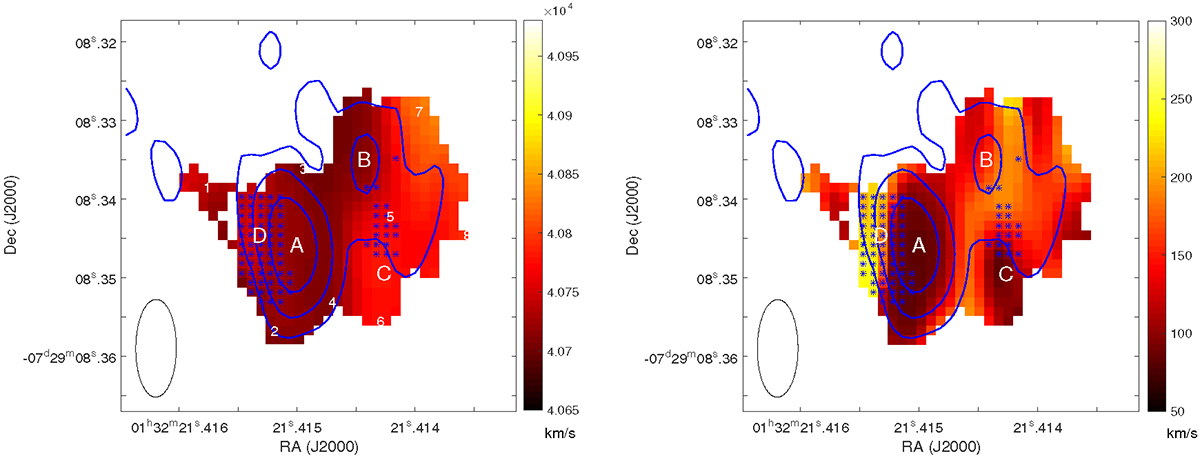
Fig. 4.
Download original image
Velocity (left panel) and FWHM line-width distributions (right panel) of OHM emission from our VLBA observation. A, B, C, and D represent the locations of four bright OH components. The numbers 1–8 represent the example pixel from which we extracted OH line profiles. The ellipse at the bottom left of each panel represents the synthesised beam of each channel image. The contours indicate the OH emission channel image at V = 40709.3 km s−1 at levels of 0.005 Jy beam−1*(1,2,4,8...). The blue spots indicate where the extracted spectra show two or more peaks, roughly distributed in regions around component D and between B and C.
Current usage metrics show cumulative count of Article Views (full-text article views including HTML views, PDF and ePub downloads, according to the available data) and Abstracts Views on Vision4Press platform.
Data correspond to usage on the plateform after 2015. The current usage metrics is available 48-96 hours after online publication and is updated daily on week days.
Initial download of the metrics may take a while.