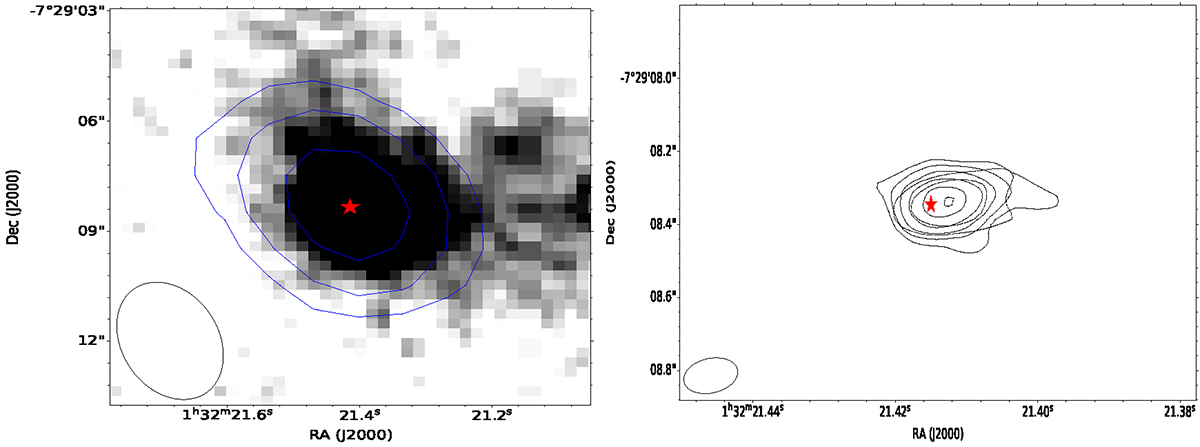
Fig. 3.
Download original image
OH emission overlaid on multi-band images of IRAS 01298−0744. Left panel: blue contours indicate the Very Large Array Sky Survey (VLASS, Lacy et al. 2020) continuum emission (with contour levels of 0.33 mJy beam−1 × (1, 2, 4)) superposed on an SDSS R-band grey image. Right panel: dashed lines show continuum emission from ALMA observations at 235 GHz, with contour levels of 0.1 mJy beam−1 × (1,2,4), while the solid contours represent HCN line emission (J = 3 − 2) with levels of 0.23 mJy beam−1 × (1, 2, 4, 8, 16). As the OH emission region is relatively small when compared to the two images, the red star in both images denotes the location of the OH emission, identified by the coordinates RA: 01 32 21.415 and Dec: −07 29 08.347.
Current usage metrics show cumulative count of Article Views (full-text article views including HTML views, PDF and ePub downloads, according to the available data) and Abstracts Views on Vision4Press platform.
Data correspond to usage on the plateform after 2015. The current usage metrics is available 48-96 hours after online publication and is updated daily on week days.
Initial download of the metrics may take a while.