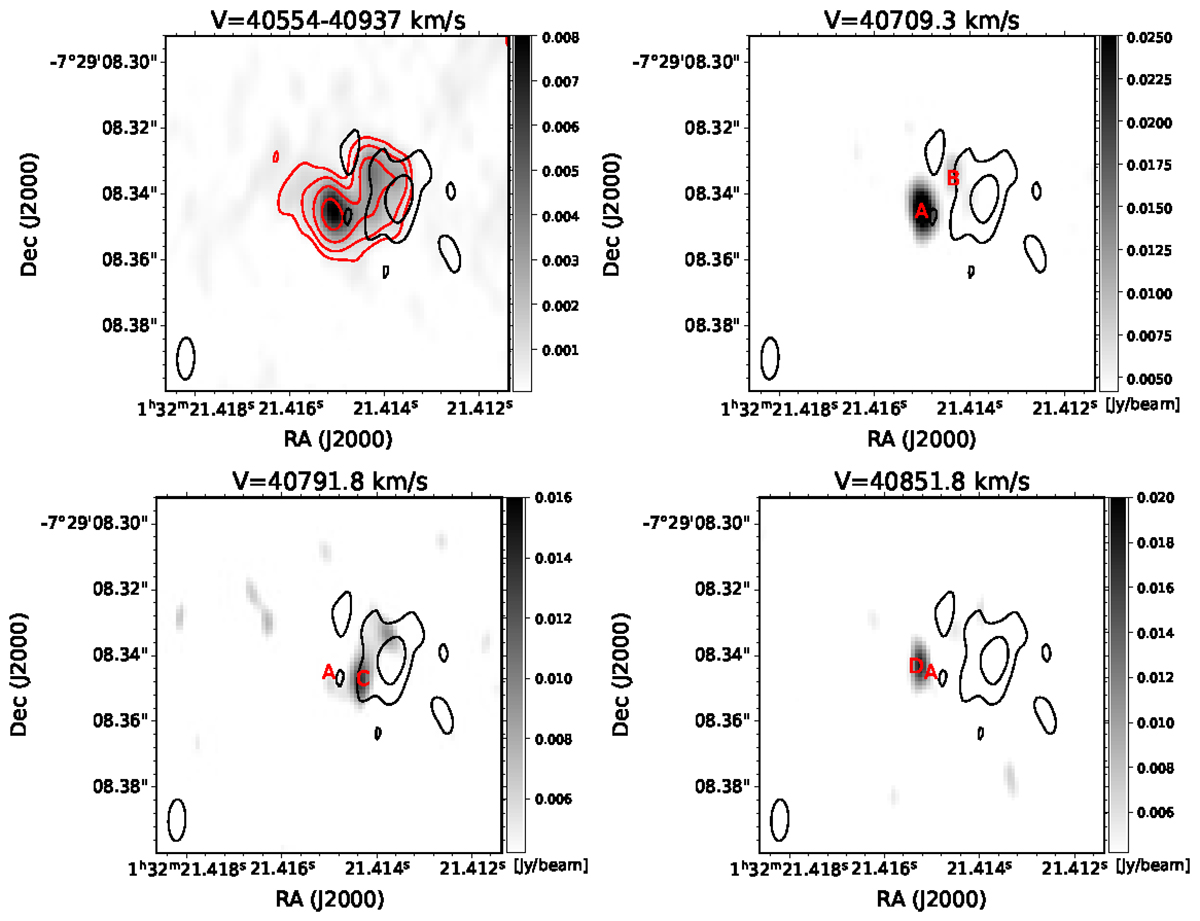
Fig. 2.
Download original image
OH line emission maps of IRAS 01298−0744 from VLBA observation. The top left image shows the integrated channel image of OH emission encompassing velocities from 40 554 to 40 937 km s−1. The other three images depict channel images at three peak velocities, each with a velocity width of approximately 3.8 km s−1, highlighting the brightest components A, B, C, and D. Their respective coordinates are as follows: A: 01 32 21.415, −07 29 08.346; B: 01 32 21.414, −07 29 08.336; C: 01 32 21.414, −07 29 08.348; D: 01 32 21.415, and −07 29 08.344. The red and black contours represent the OH line emission (40 554–40 937 km s−1), with contour levels of 0.72 mJy beam−1 × (1, 2, 4, 8), and the radio continuum emission, with contour levels of 0.06 mJy beam−1 × (1, 2), respectively. The colour bar on the right of each figure shows the OH line flux densities at each pixel in Jy beam−1. The synthesised beam of each channel image is shown in the bottom left corner.
Current usage metrics show cumulative count of Article Views (full-text article views including HTML views, PDF and ePub downloads, according to the available data) and Abstracts Views on Vision4Press platform.
Data correspond to usage on the plateform after 2015. The current usage metrics is available 48-96 hours after online publication and is updated daily on week days.
Initial download of the metrics may take a while.