Open Access
Fig. A.1.
Download original image
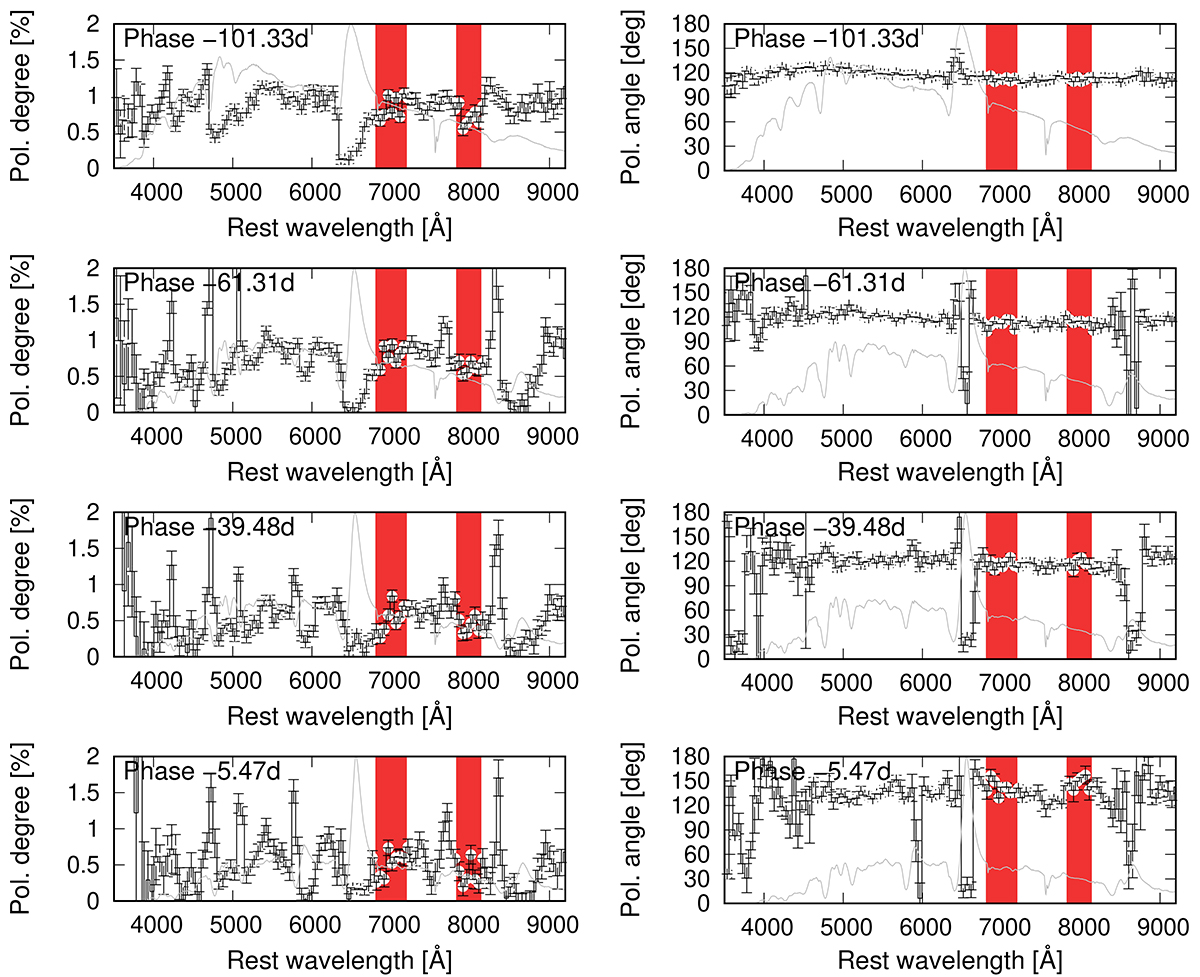
Polarization degree (left) and angle (right) of SN 2021yja. The red hatching shows the adopted wavelength range for the estimation of continuum polarization. The grey lines in the background of each plot are the unbinned flux spectra at the corresponding epochs.
Current usage metrics show cumulative count of Article Views (full-text article views including HTML views, PDF and ePub downloads, according to the available data) and Abstracts Views on Vision4Press platform.
Data correspond to usage on the plateform after 2015. The current usage metrics is available 48-96 hours after online publication and is updated daily on week days.
Initial download of the metrics may take a while.