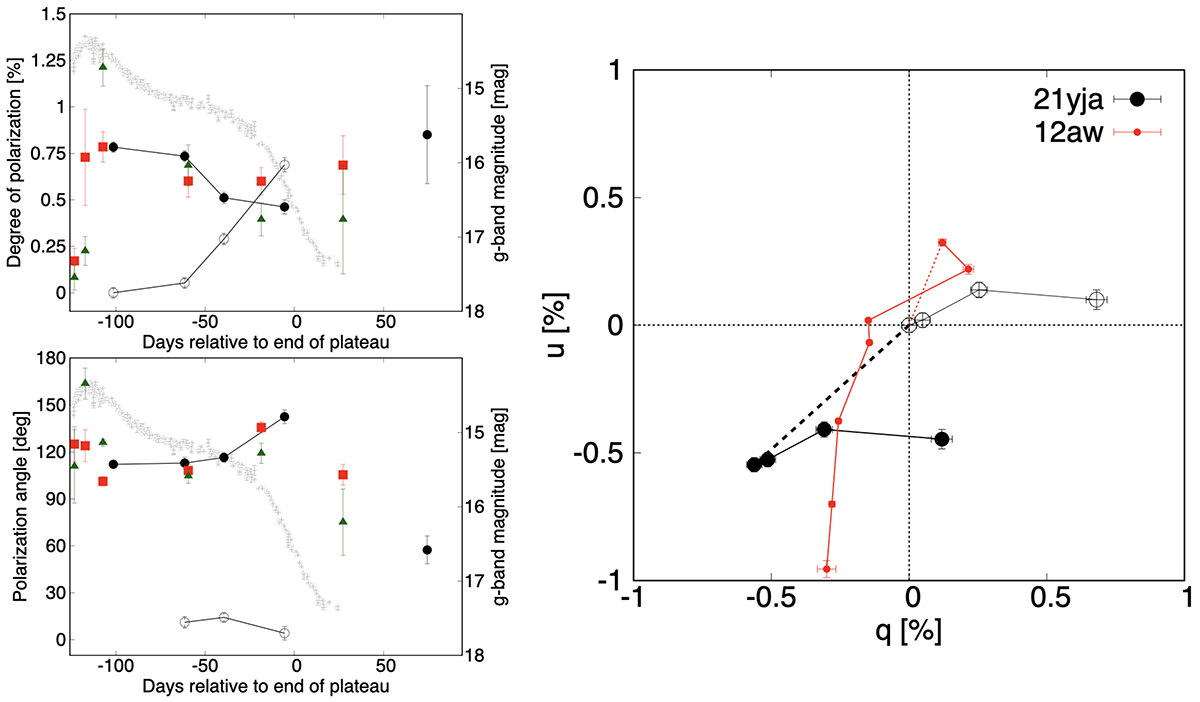
Fig. 1.
Download original image
Time evolution of the continuum polarization of SN 2021yja. Left panel: Polarization degree and angle of SN 2021yja. The filled black circles connected by a solid line show the continuum polarization derived from the polarization spectra, while the filled green triangles and red squares show the values from the V- and R-band imaging polarimetry. The open black circles represent only the second component of the continuum polarization. The gray crosses trace the g-band light curve of SN 2021yja taken from Hosseinzadeh et al. (2022). Right panel: Time evolution of the continuum polarization in the q-u plane compared to that of SN 2012aw. The first epochs are indicated with dotted lines. The open black circles are the same in the left panels, representing only the second component of the continuum polarization.
Current usage metrics show cumulative count of Article Views (full-text article views including HTML views, PDF and ePub downloads, according to the available data) and Abstracts Views on Vision4Press platform.
Data correspond to usage on the plateform after 2015. The current usage metrics is available 48-96 hours after online publication and is updated daily on week days.
Initial download of the metrics may take a while.