Fig. 5
Download original image
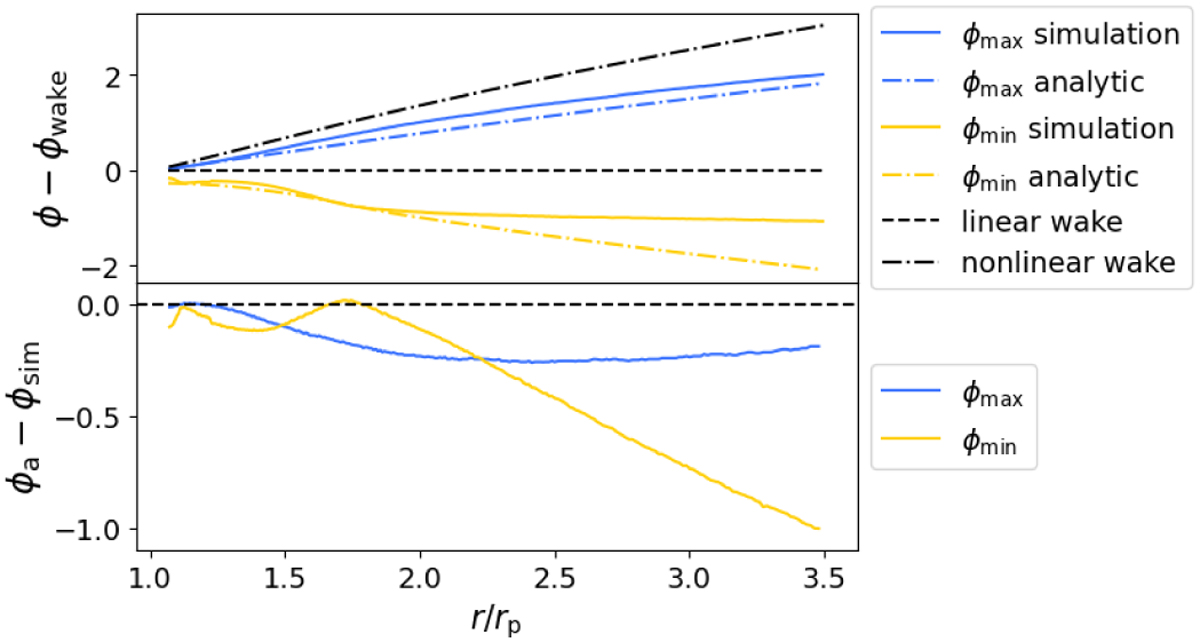
Azimuthal deviation of the pitch angle from the linear prediction. Top panel: azimuthal distance of the maximum (blue) and minimum (yellow) from the linear wake prediction for the Mp = 1.00 mth case. We used this estimate to trace the pitch angle of the spiral wake. Solid lines represent the values obtained from the simulation, while dash dotted lines are obtained from the analytical model. Bottom panel: difference between the maximum (blue) and minimum (yellow) from the analytical model and the simulation as a function of the disc radius.
Current usage metrics show cumulative count of Article Views (full-text article views including HTML views, PDF and ePub downloads, according to the available data) and Abstracts Views on Vision4Press platform.
Data correspond to usage on the plateform after 2015. The current usage metrics is available 48-96 hours after online publication and is updated daily on week days.
Initial download of the metrics may take a while.