Fig. A.1

Download original image
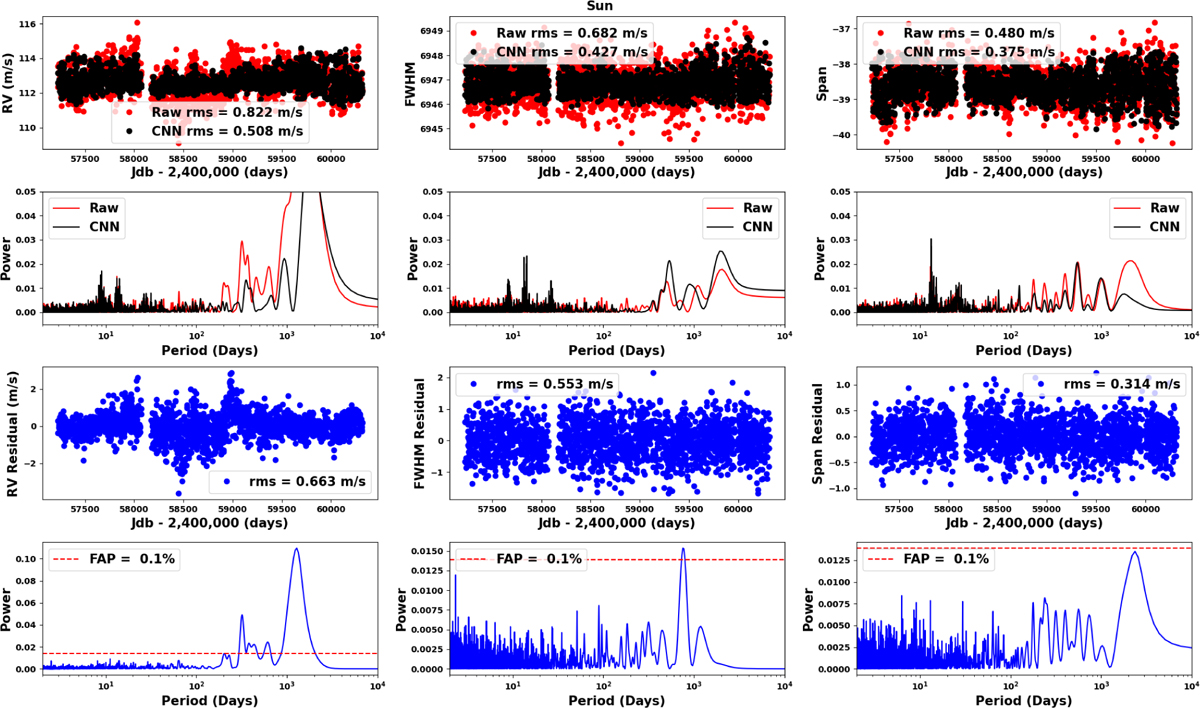
Results of stellar activity modeling on the HARPS-N solar data with our trained neural network. The results of our neural network modeling on RVs, FWHM and BIS are shown in the left, middle and right columns, respectively. The first panels of each column shows the physical parameter derived from the specific solar cross-correlation mask and the one predicted by the neural network. Their corresponding periodograms are shown in the second panels of each column. The residuals of each physical parameter are shown in the third panels of each column. The last panels of each column shows the periodogram of the corresponding residuals. The FAP level of 0.1% is present in red dashed line.
Current usage metrics show cumulative count of Article Views (full-text article views including HTML views, PDF and ePub downloads, according to the available data) and Abstracts Views on Vision4Press platform.
Data correspond to usage on the plateform after 2015. The current usage metrics is available 48-96 hours after online publication and is updated daily on week days.
Initial download of the metrics may take a while.


