Fig. 1

Download original image
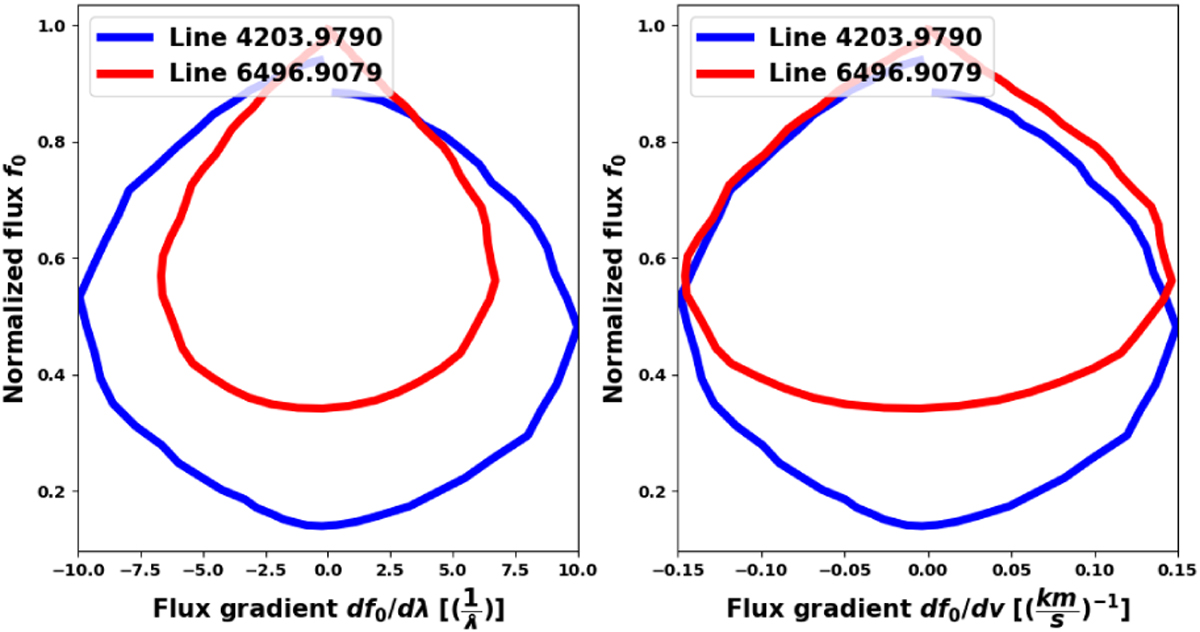
Shell spectral representation of two spectral lines at opposite edges of the visible spectral range. Left: two spectral lines in the ![]() shell space. Line 4203.9790 Å at the blue part of the spectrum has the larger loop than Line 6496.9079 Å at the red part of the spectrum in
shell space. Line 4203.9790 Å at the blue part of the spectrum has the larger loop than Line 6496.9079 Å at the red part of the spectrum in ![]() space. Right: line 4203.9790 Å and 6496.9079 Å in the
space. Right: line 4203.9790 Å and 6496.9079 Å in the ![]() shell space. The line in the blue part of the spectrum follow the same loop as the line in the red part when considering the common normalized flux, from 0.9 to 0.4. Therefore, the chromatic effect due to dispersion is suppresed in the
shell space. The line in the blue part of the spectrum follow the same loop as the line in the red part when considering the common normalized flux, from 0.9 to 0.4. Therefore, the chromatic effect due to dispersion is suppresed in the ![]() shell space.
shell space.
Current usage metrics show cumulative count of Article Views (full-text article views including HTML views, PDF and ePub downloads, according to the available data) and Abstracts Views on Vision4Press platform.
Data correspond to usage on the plateform after 2015. The current usage metrics is available 48-96 hours after online publication and is updated daily on week days.
Initial download of the metrics may take a while.


