Fig. 3
Download original image
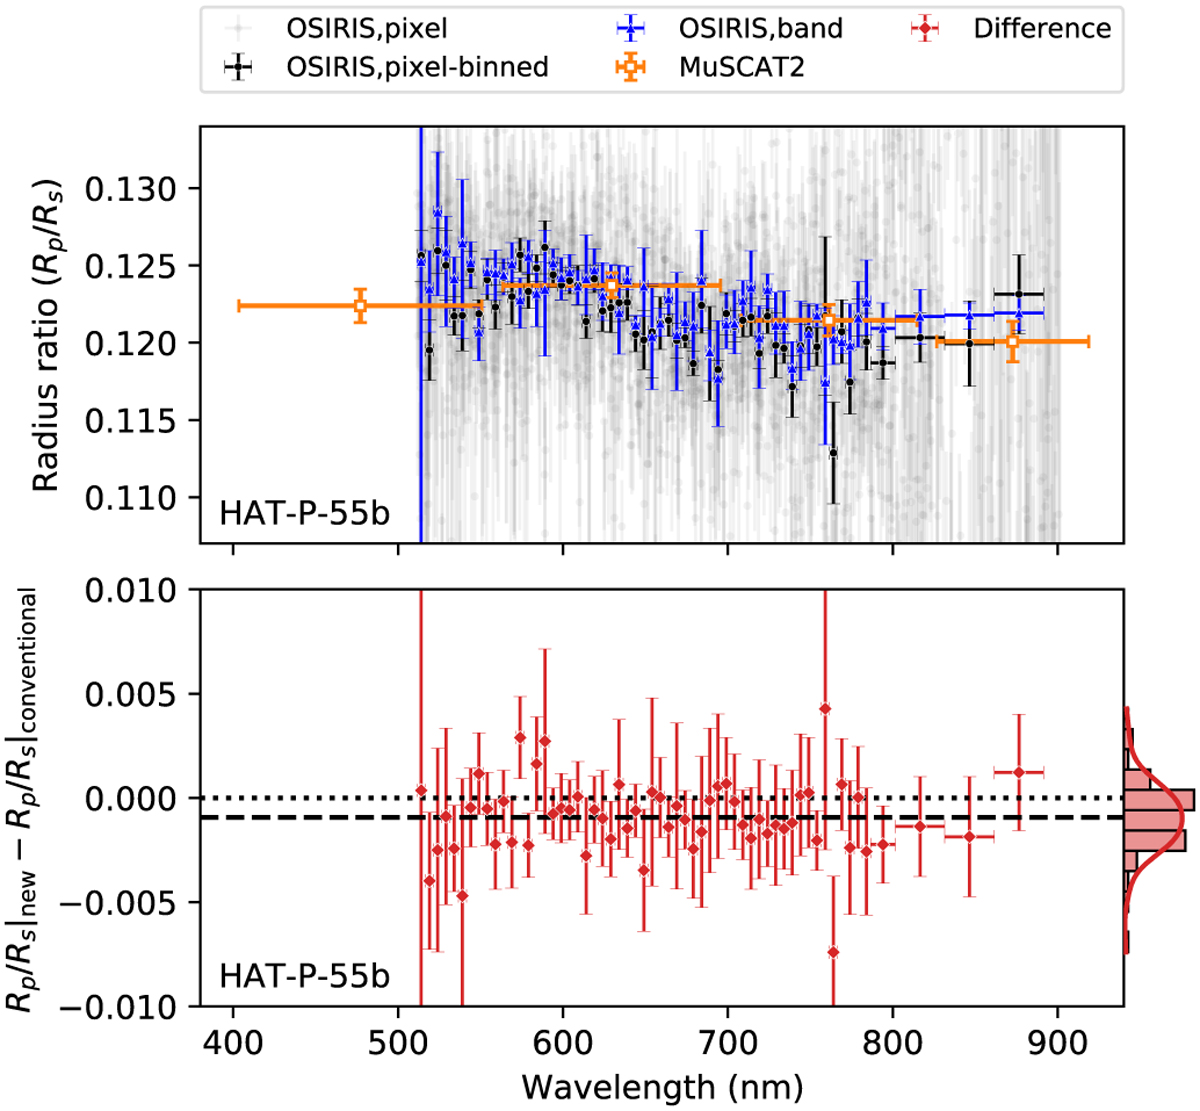
Comparison of HAT-P-55b’s transmission spectra. Upper panel: transmission spectra of HAT-P-55b. The blue triangles and black circles show the OSIRIS transmission spectra obtained with the conventional (“band”) and new (“pixel-binned”) methods. The gray dots show the pixel transmission spectrum. The orange squares show the broadband transmission spectrum obtained with MuSCAT2 by Kang et al. (2024). Bottom panel: difference between the new and conventional methods (red diamonds) and the corresponding histogram. The dashed line marks an overall offset of ΔRp/R★ = −0.00094.
Current usage metrics show cumulative count of Article Views (full-text article views including HTML views, PDF and ePub downloads, according to the available data) and Abstracts Views on Vision4Press platform.
Data correspond to usage on the plateform after 2015. The current usage metrics is available 48-96 hours after online publication and is updated daily on week days.
Initial download of the metrics may take a while.