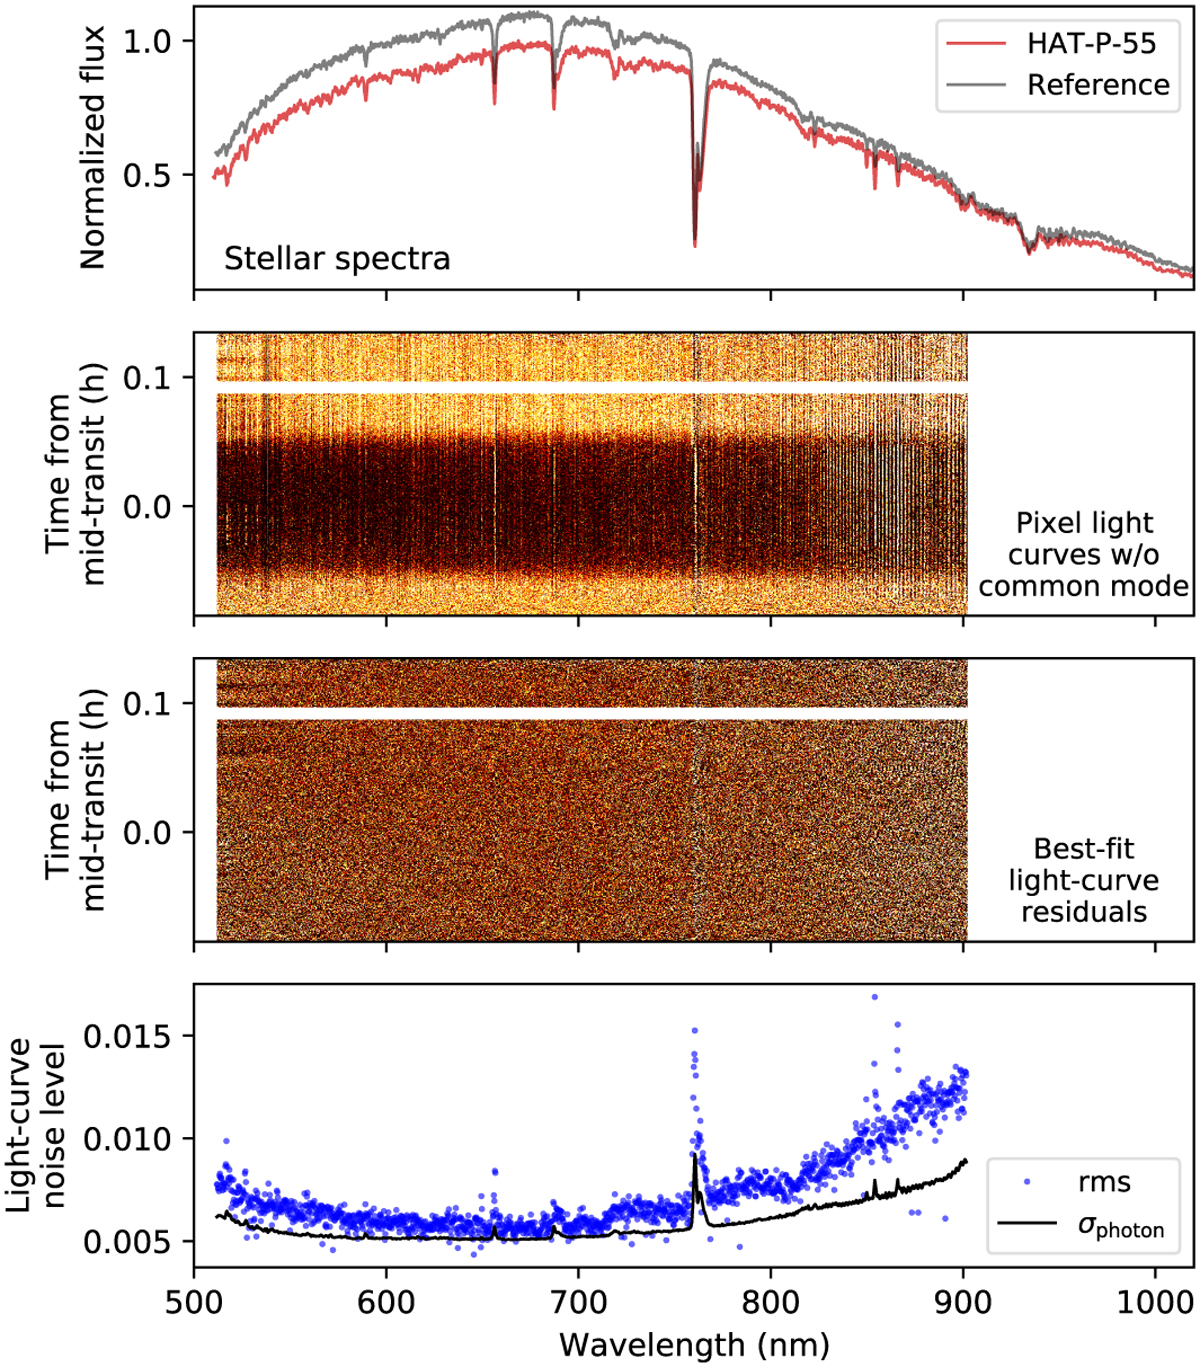
Fig. 2
Download original image
Pixel-by-pixel spectroscopic light curves of HAT-P-55 observed with GTC/OSIRIS. First row: spectra of HAT-P-55 and the reference star. Second row: matrix of pixel light curves after removal of the common mode systematics. Third row: matrix of the best-fit light curve residuals. Fourth row: rms of each pixel light curve, compared to the expected photon noise.
Current usage metrics show cumulative count of Article Views (full-text article views including HTML views, PDF and ePub downloads, according to the available data) and Abstracts Views on Vision4Press platform.
Data correspond to usage on the plateform after 2015. The current usage metrics is available 48-96 hours after online publication and is updated daily on week days.
Initial download of the metrics may take a while.