Fig. 1
Download original image
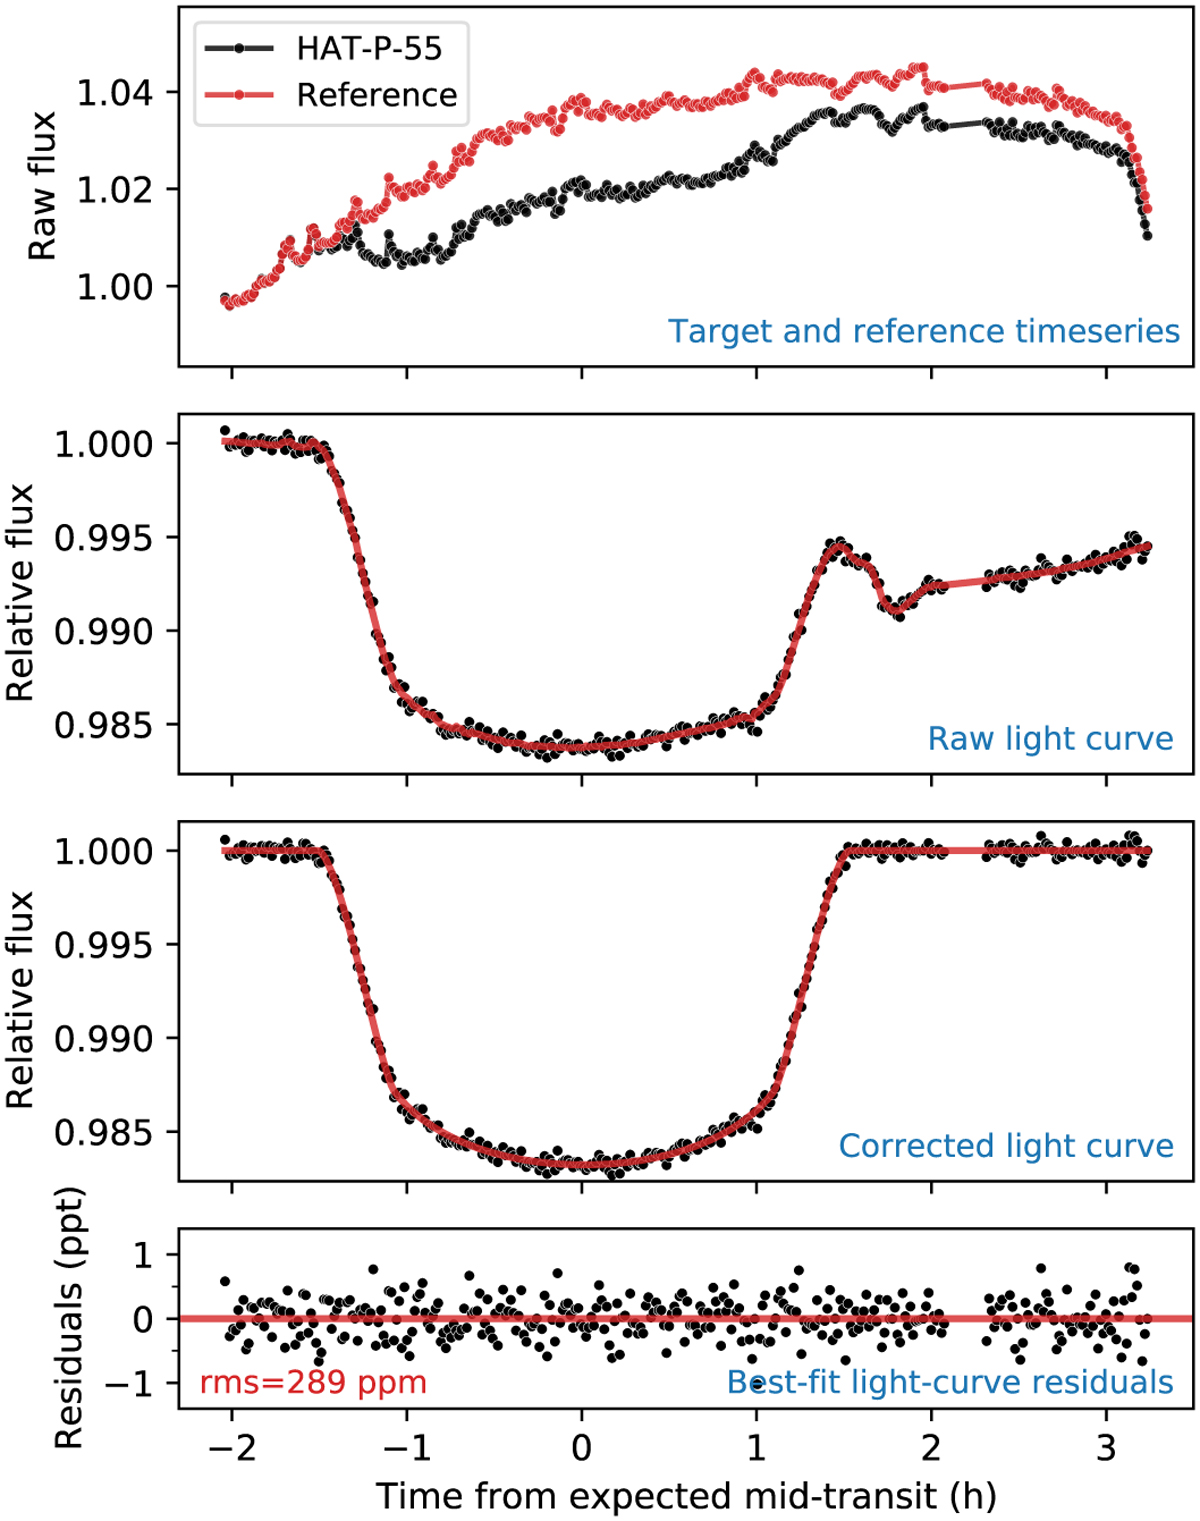
Band-integrated white light curve of HAT-P-55 observed with GTC/OSIRIS. First row: flux time series of HAT-P-55 and its reference star. Second row: raw light curve after dividing the flux of HAT-P-55 by that of the reference. The red line represents the best-fit combined transit and systematics model. Third row: light curve after removal of the systematics. Fourth row: Best-fit light curve residuals.
Current usage metrics show cumulative count of Article Views (full-text article views including HTML views, PDF and ePub downloads, according to the available data) and Abstracts Views on Vision4Press platform.
Data correspond to usage on the plateform after 2015. The current usage metrics is available 48-96 hours after online publication and is updated daily on week days.
Initial download of the metrics may take a while.