Fig. 6.
Download original image
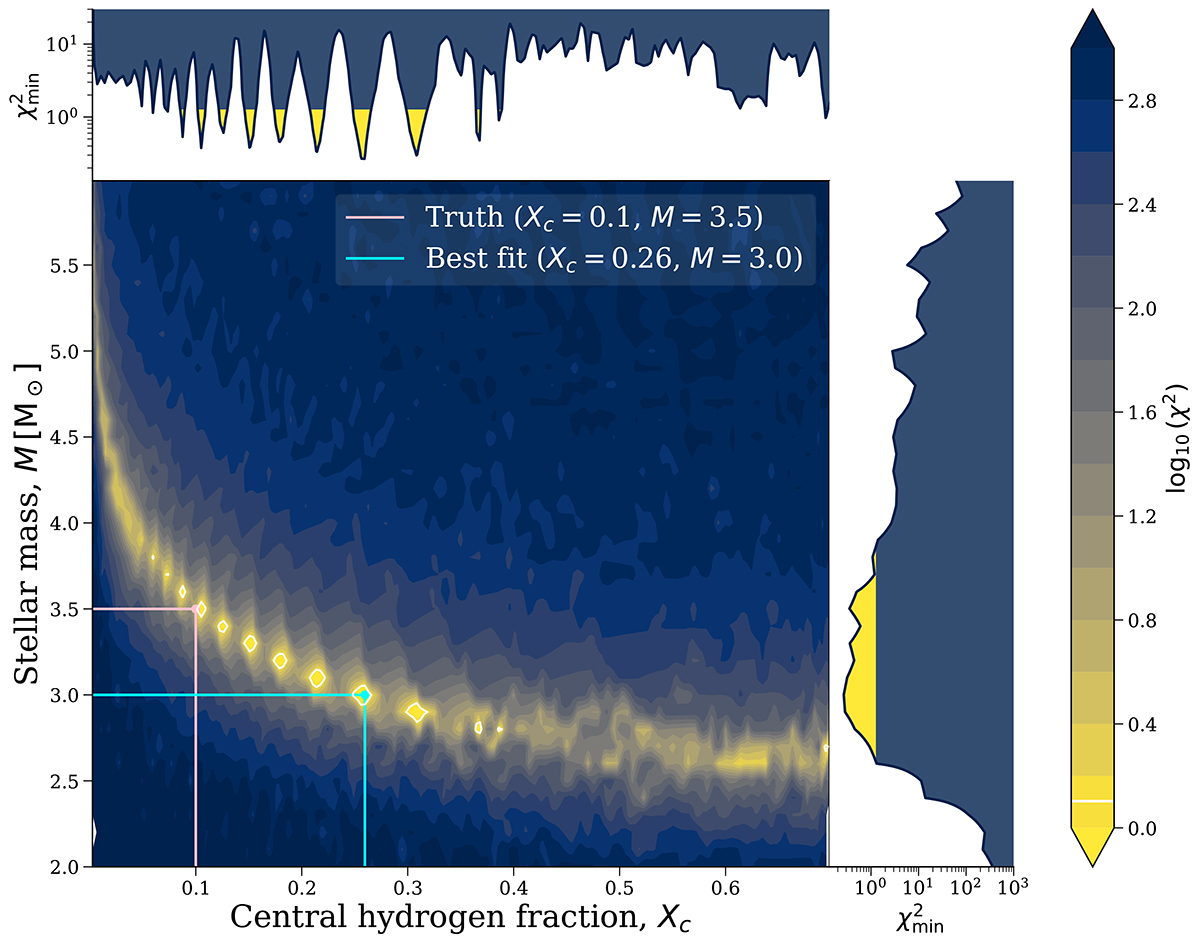
Stellar properties could be inferred incorrectly when assuming single star evolution if one does not consider the full multimodal posteriors. The main panel shows the χ2 values for fitting our M = 3.5 M⊙ mass-gainer model at Xc = 0.1 with our entire grid of single star models. The true and best-fit values are highlighted with lines. We add white contour lines at ![]() to highlight models that are statistically compatible with the true value. The side panels show marginal distributions (the minimum χ2 marginalised over a given axis), where any values with
to highlight models that are statistically compatible with the true value. The side panels show marginal distributions (the minimum χ2 marginalised over a given axis), where any values with ![]() are filled with yellow to mark them as statistically compatible.
are filled with yellow to mark them as statistically compatible.
Current usage metrics show cumulative count of Article Views (full-text article views including HTML views, PDF and ePub downloads, according to the available data) and Abstracts Views on Vision4Press platform.
Data correspond to usage on the plateform after 2015. The current usage metrics is available 48-96 hours after online publication and is updated daily on week days.
Initial download of the metrics may take a while.