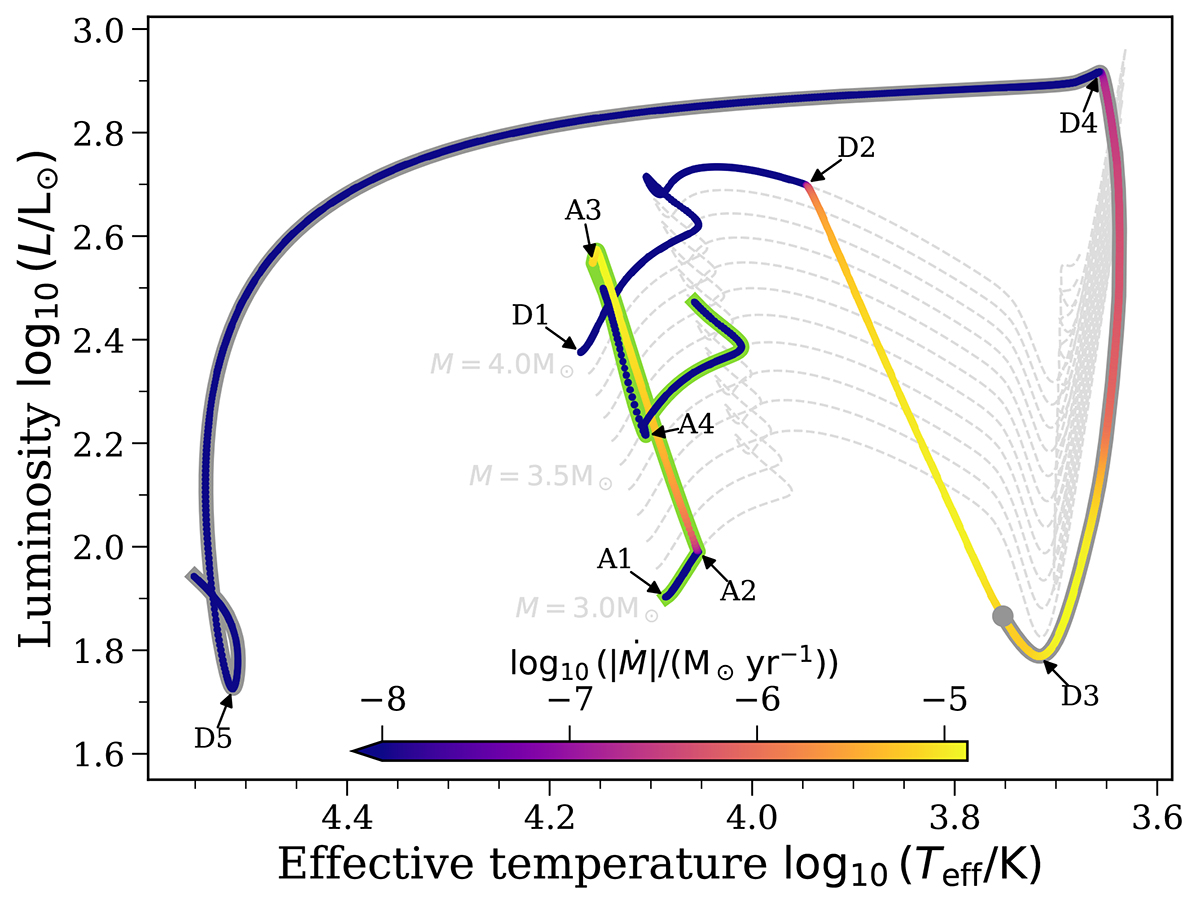
Fig. 1.
Download original image
Hertzsprung–Russell diagram showing the evolution of the binary. Tracks are coloured by the mass loss and mass accretion rate of the donor (marked D1-5) and accretor (marked A1-4); see Sect. 3.1 for an explanation of the labels. We limited the accretion on the companion to 0.5 M⊙ and followed its further evolution until core hydrogen exhaustion (see Sect. 2.1 for details on the technical implementation). The point at which 0.5 M⊙ of material has been accreted is noted with a grey circle and subsequent evolution is highlighted in grey. For reference, we show single star tracks as dashed light grey curves, with masses from 3 to 4 M⊙ in 0.1 M⊙ intervals. An interactive plot is available at https://www.tomwagg.com/html/interact/mass-gainer-asteroseismology.html#fig1.
Current usage metrics show cumulative count of Article Views (full-text article views including HTML views, PDF and ePub downloads, according to the available data) and Abstracts Views on Vision4Press platform.
Data correspond to usage on the plateform after 2015. The current usage metrics is available 48-96 hours after online publication and is updated daily on week days.
Initial download of the metrics may take a while.