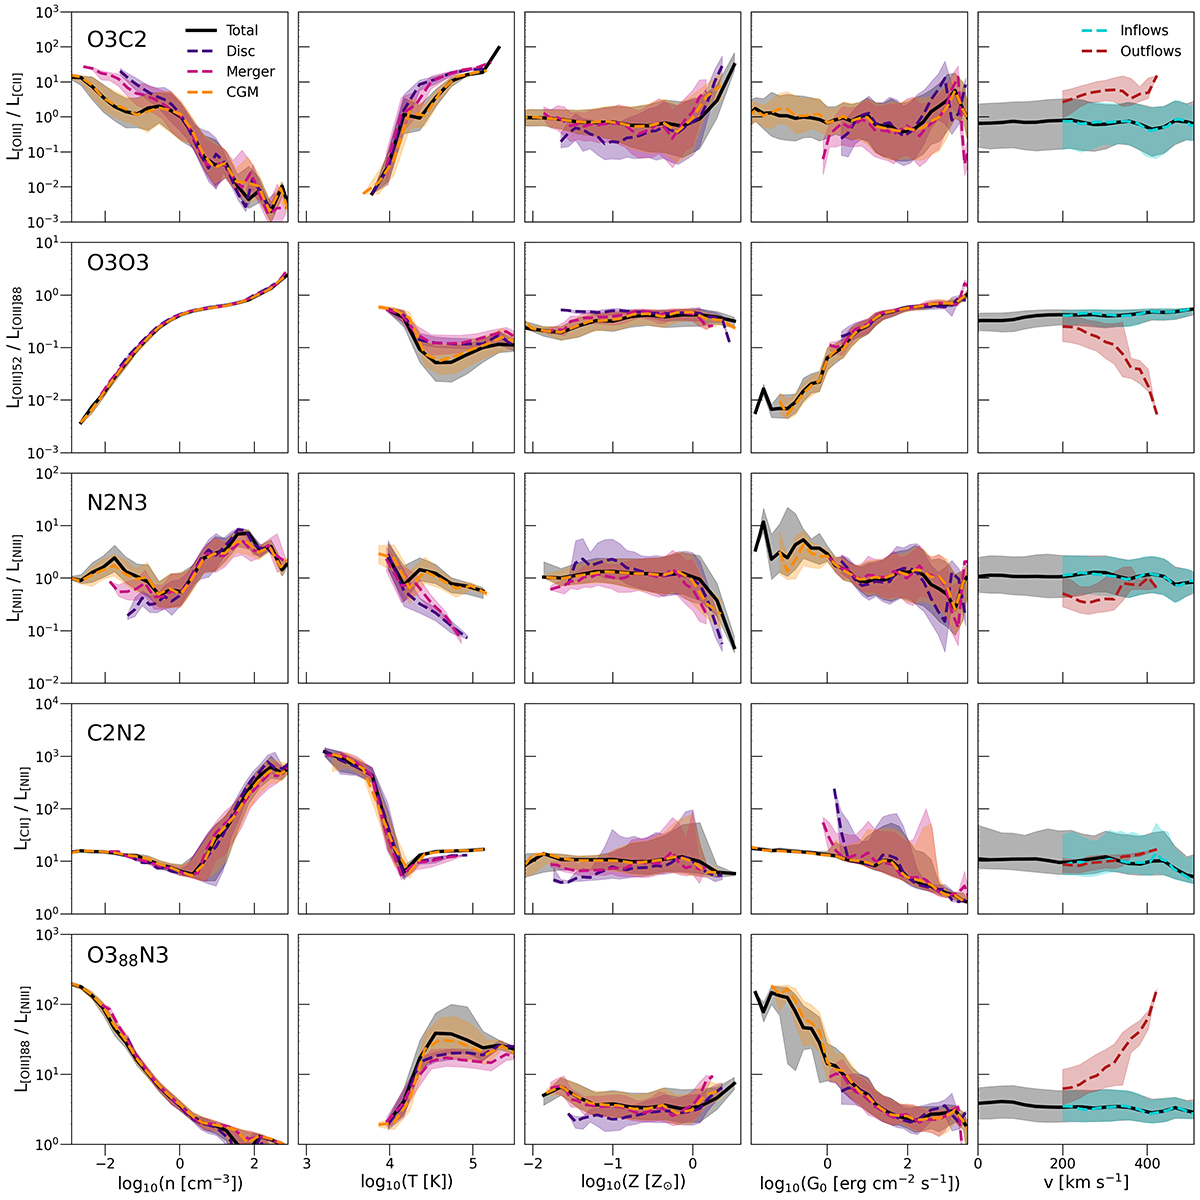
Fig. 3.
Download original image
Median of the line ratios plotted as a function of gas density, temperature, metallicity, UV field, and absolute velocity of the gas cells. The ratios are divided into the total halo (black), the disc (indigo), the merger components (magenta), and the CGM (orange), except for the absolute velocity panel, in which we divide the gas into inflowing (blue) and outflowing (red) gas. The shaded areas correspond to the 25th and 75th percentiles.
Current usage metrics show cumulative count of Article Views (full-text article views including HTML views, PDF and ePub downloads, according to the available data) and Abstracts Views on Vision4Press platform.
Data correspond to usage on the plateform after 2015. The current usage metrics is available 48-96 hours after online publication and is updated daily on week days.
Initial download of the metrics may take a while.